- 7/9/2026


 Petko Aleksandrov
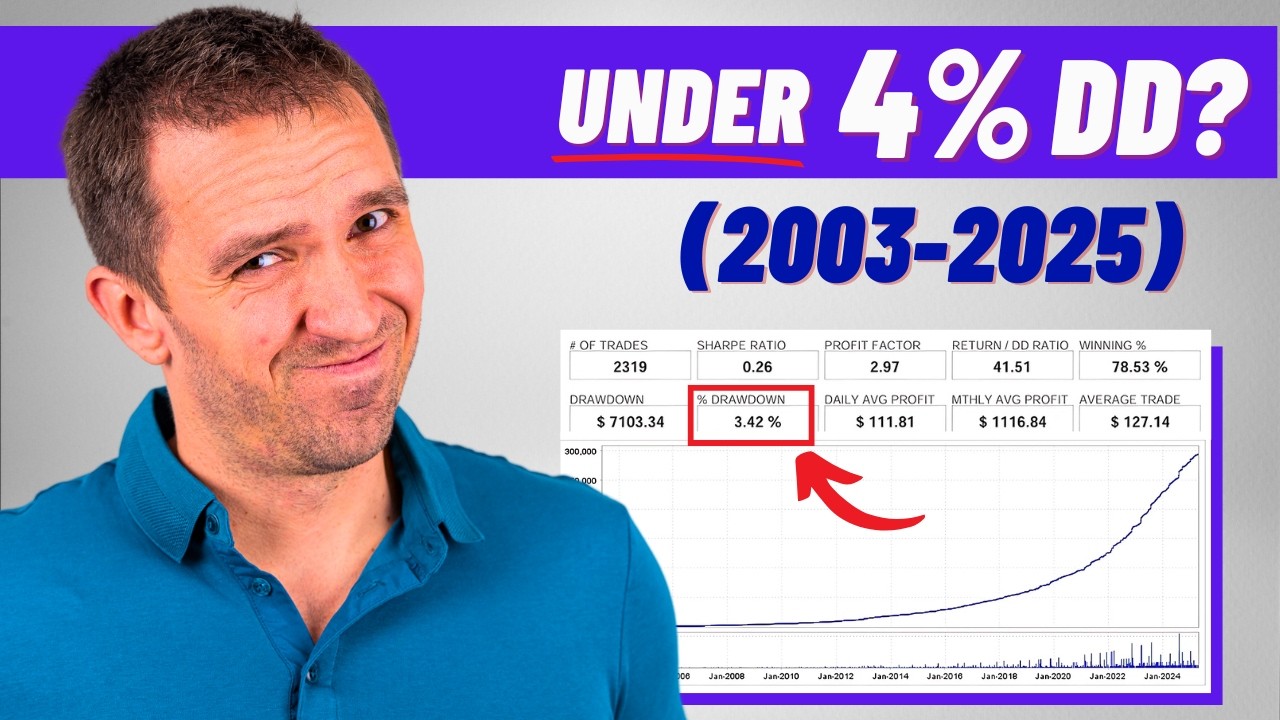
After testing hundreds of expert advisors over the years, finding one that genuinely stands out becomes increasingly rare. Market Master EA caught my attention for a specific reason: it produced a 20-year backtest with only 3.42% drawdown. I had to read that number twice. That’s not just low; it’s exceptional by any standard in automated trading.
I’ve been running Market Master on both demo and funded accounts since February, and the live results are telling a story that aligns closely with those historical backtests. This isn’t another high-frequency scalper promising the moon. It’s a measured, selective system that prioritizes capital preservation over aggressive gains.
Let me walk through what I’ve found, including the actual trade history, performance metrics, and whether this EA justifies the hype around its remarkably low drawdown.
How Market Master Actually Trades
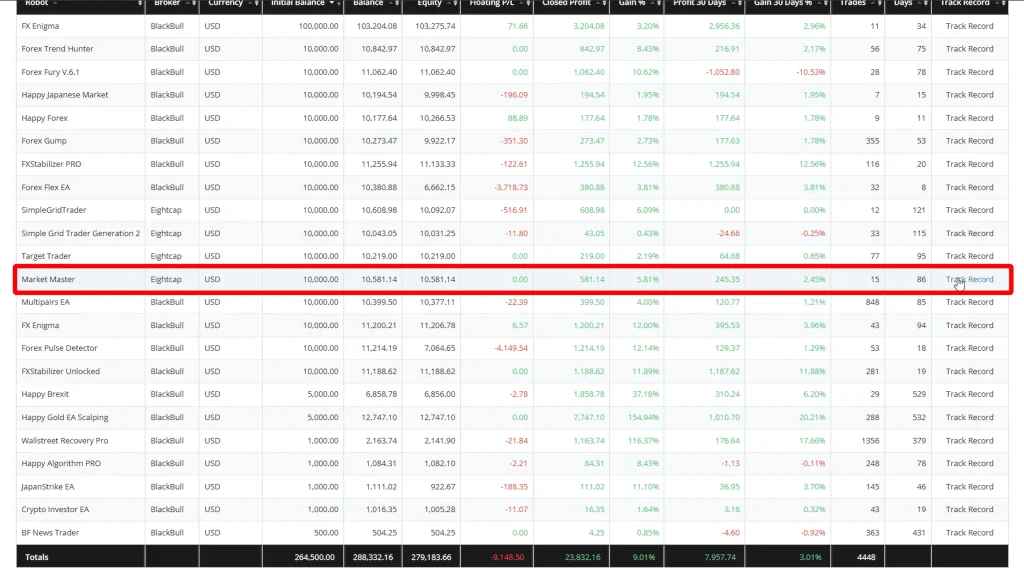
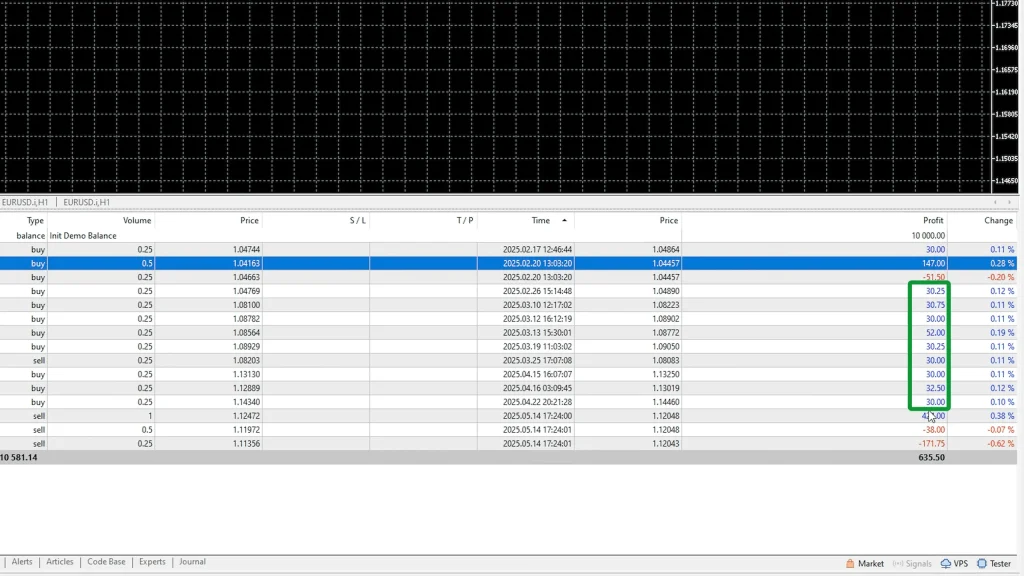
Market Master doesn’t flood your account with trades. That became obvious within the first week of testing. From February 17th through May 20th, over three months, the demo account executed a relatively small number of positions compared to most EAs I run.
But here’s what stood out: the win rate. Looking through the trade history, I counted predominantly winning trades with only occasional losses. When losses did occur, they were immediately followed by recovery trades that brought the account back to profit.
One sequence I noticed: the EA opened a position at 0.25 lots, then added 0.5 lots, and the combined position closed profitably. That’s the grid recovery mechanism at work. It’s not randomly adding positions; there’s clear logic behind the scaling.
Trade Pattern Analysis
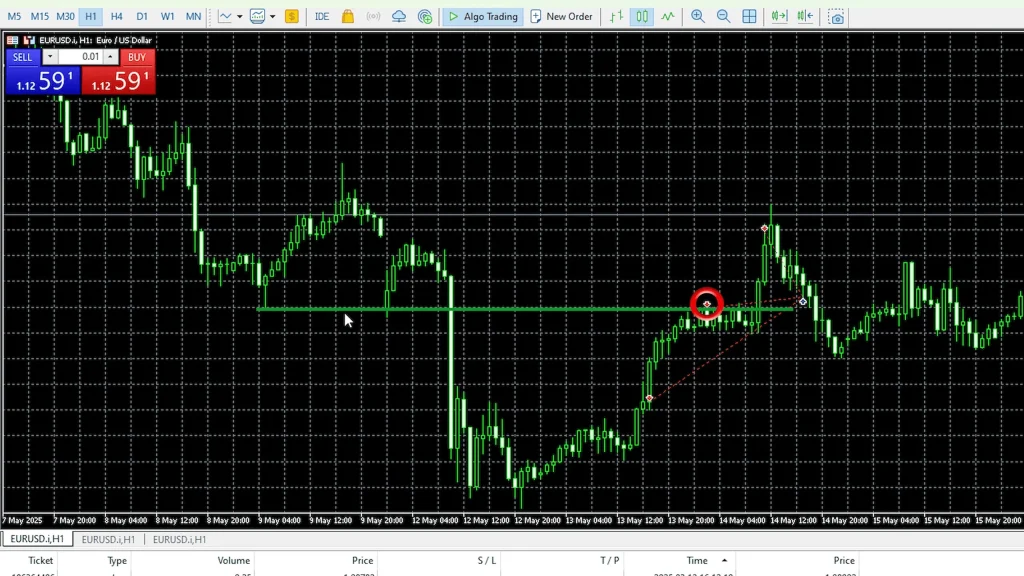
Examining the EUR/USD chart where most activity occurred, I started piecing together what triggers entries. The EA appears to use some form of price action analysis, possibly combined with Fibonacci retracements, though I can’t confirm the exact methodology since the code isn’t visible.
What I could observe:
- Long trades are often opened after support levels are broken and retested
- Short trades triggered near resistance zones that had been breached
- Position sizing followed a specific multiplier pattern
- Take profit targets were consistently set at 12 pips
The recent trading activity showed three short positions in succession, all closing profitably. Before that, multiple long trades hit their profit targets. The consistency is what impressed me more than any single large win.
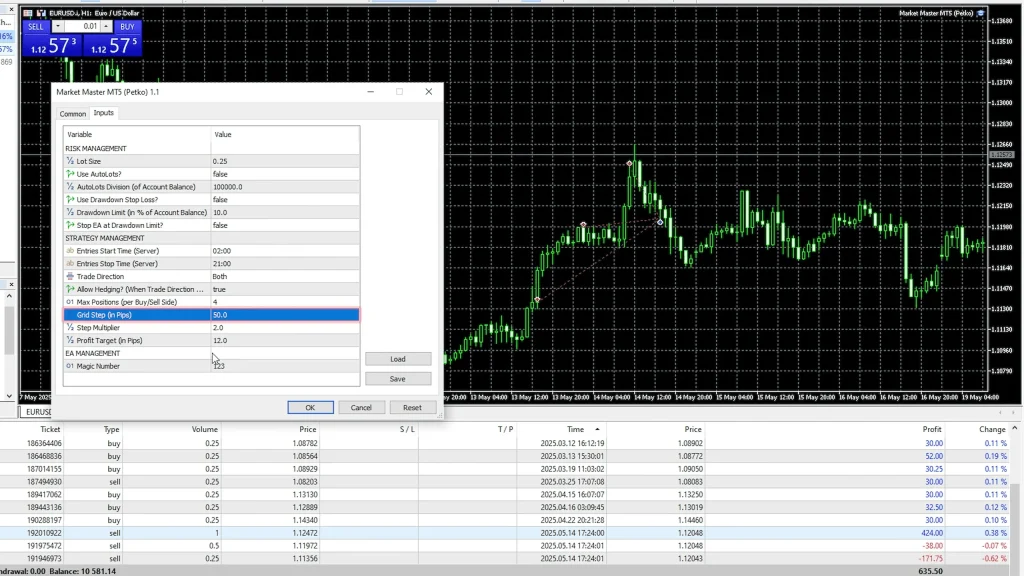
Default Settings and Grid Configuration
I’m using Market Master with completely default settings. No optimization, no tweaking, just the configuration that ships with the EA. This matters because it eliminates the risk of curve-fitting parameters to historical data.
The key settings include:
| Parameter | Default Value | Purpose |
| Grid Step | 50 pips | Distance between additional positions |
| Step Multiplier | 2 | Lot size increase per level |
| Profit Target | 12 pips | Take profit distance |
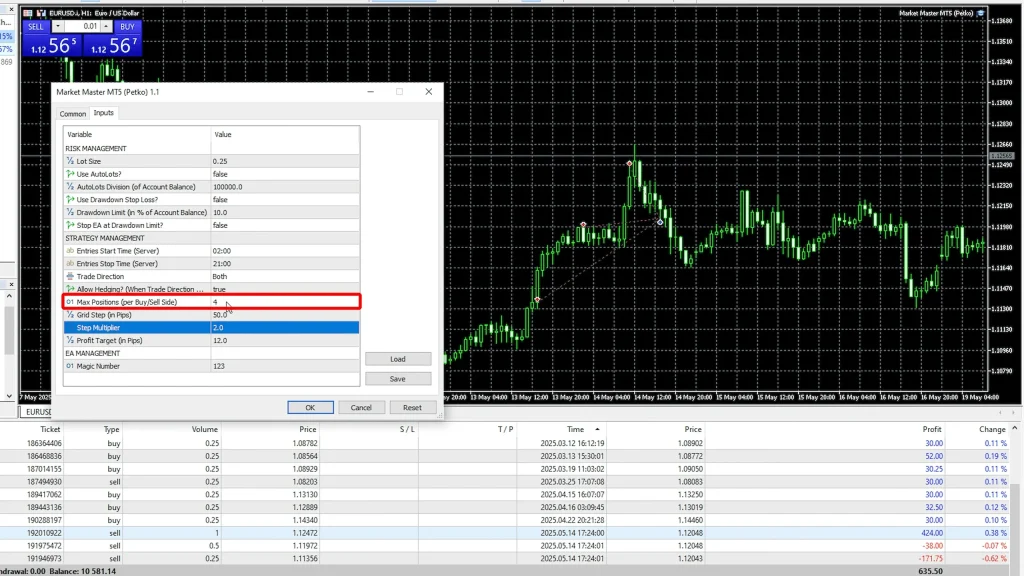
| Max Positions | 4 | Maximum recovery trades |
| Initial Lot | 0.25 | Starting position size |
The grid step of 50 pips means that if the first trade goes against you, the next position opens 50 pips away. With a multiplier of 2, lot sizes double at each level: 0.25, then 0.5, then 1.0, then 2.0 lots maximum.
That four-position limit is critical. Without it, a strong adverse move could deplete your margin completely. The developer clearly understood this risk and built in protection.
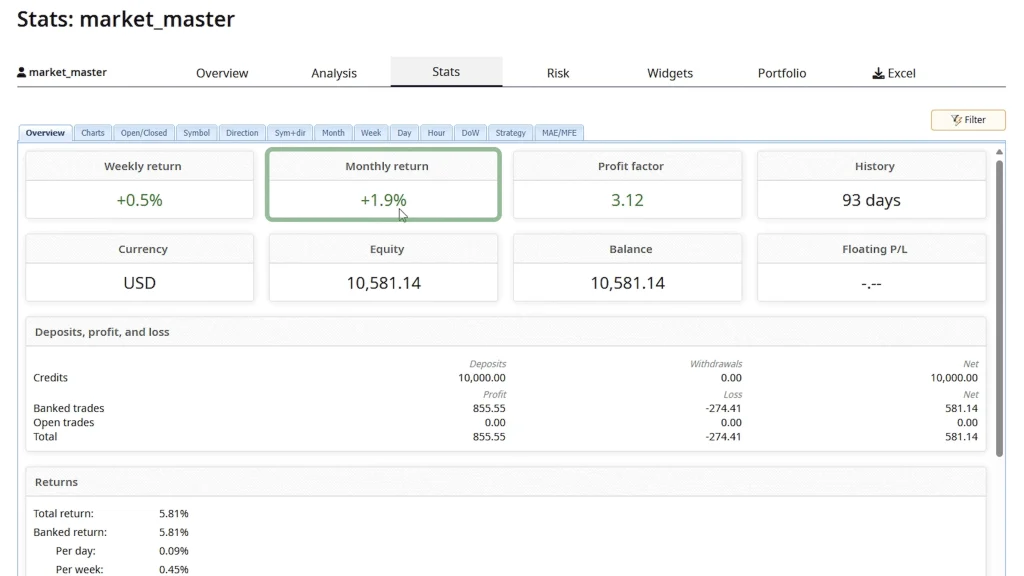
Demo Account Performance: Three Months of Data
My $10,000 demo account has been running since mid-February. The results show an average monthly return of around 1.9%, nearly 2% per month. That might sound modest compared to EAs promising 10-20% monthly, but context matters.
A 2% monthly return with minimal drawdown compounds beautifully over time. More importantly, it’s sustainable. The profit factor on this demo account is exceptionally high, confirming that wins substantially outweigh losses even after accounting for the occasional grid recovery.
Looking at individual trades, I saw sequences like this: profitable long, profitable long, profitable long, then a small loss of $171, followed by another small loss of $38, both recovered by a $424 win. The recovery mechanism worked exactly as designed.
Recent trade history showed three consecutive short trades, all profitable. Before that, multiple longs hit their targets. The system adapts to market direction rather than fighting trends.
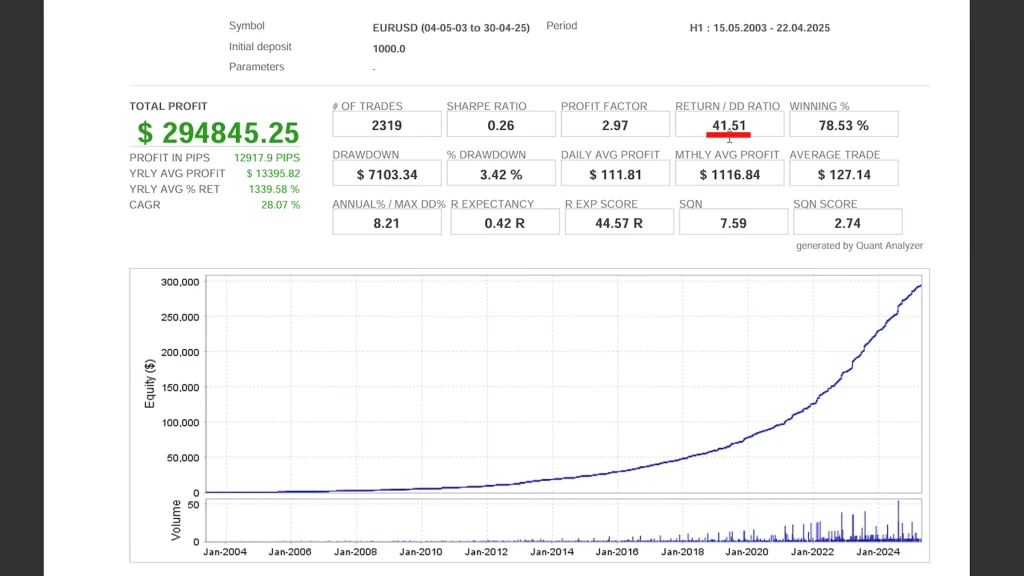
The 20-Year Backtest That Changed My Perspective
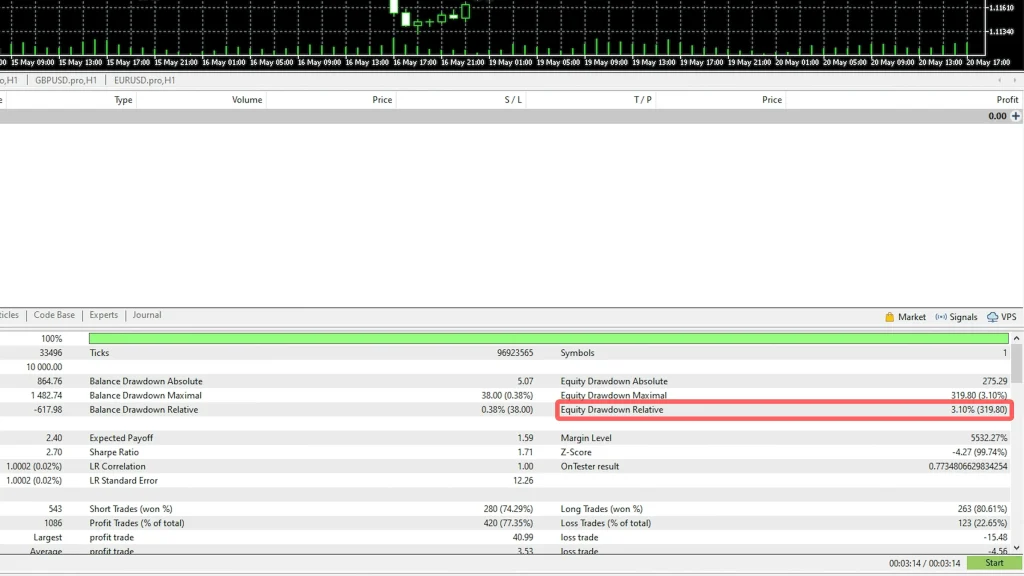
The vendor provided a backtest covering 2003 through April of this year, over two decades of data. The results aren’t just good; they’re exceptional by professional standards.
Critical Metrics:
- Total period: 2003-2025 (22 years)
- Maximum drawdown: 3.42%
- Return to drawdown ratio: 41.51
- Profit factor: Exceptionally high
- Monthly consistency: Steady across all time periods
That return-to-drawdown ratio of 41.51 stopped me in my tracks. For reference, anything above 3.0 is considered good. Above 10.0 is excellent. Market Master achieved 41.51 over 22 years. I’ve tested hundreds of EAs and never seen a ratio that high across such a long timeframe.
The monthly performance breakdown showed consistent profitability across different market conditions, the 2008 financial crisis, the 2010s trending markets, the 2020 pandemic volatility, and the recent inflation environments. The EA didn’t just survive these periods; it maintained steady returns.
Moving to Funded Accounts: Trading.com Challenge
Based on the demo performance and historical backtests, I deployed Market Master on a Trading.com funded account. These accounts start with $10,000 equity (though they cost $1,000 to purchase), require hitting a 20% profit target, and enforce a 10% maximum drawdown limit.
Market Master’s low drawdown profile makes it ideal for this type of challenge. Most EAs I’ve tested would struggle with a 10% drawdown ceiling. With Market Master, I’m not worried about breaching that limit based on its historical performance.
The account structure works like this:
- Stage 1: Hit 20% profit target with max 10% drawdown
- Upon success: Account doubles, you can withdraw 80% of profits
- Subsequent stages: Profit split decreases, but account size grows
- No time limit: Take as long as needed to hit targets
I already have one account at Stage Four Trading, a different EA (Forex Gold Investor), where I’ve withdrawn around $20k in profits. However, that system’s performance has been inconsistent lately, which is why I’m spreading across multiple EAs and funded accounts.
Putting Market Master on Trading.com made sense as a diversification play. It won’t hit the 20% target quickly, probably taking several months at 2% monthly returns, but the low drawdown means I can run it without constantly monitoring for margin issues.
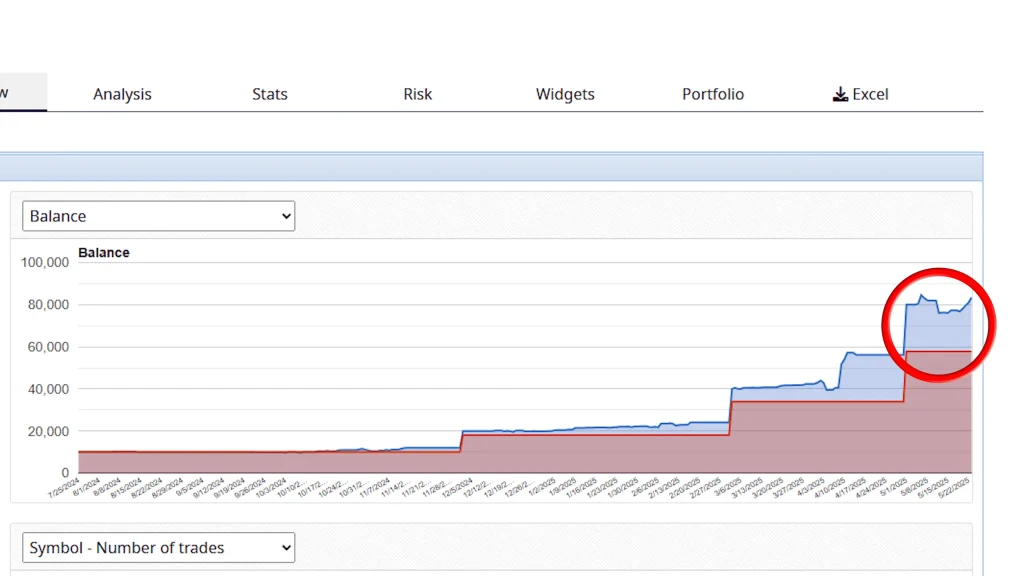
Current Live Results and Verification
The Trading.com account is publicly tracked and already showing 3% gains since inception. That’s ahead of the expected 2% monthly pace, though it’s still early.
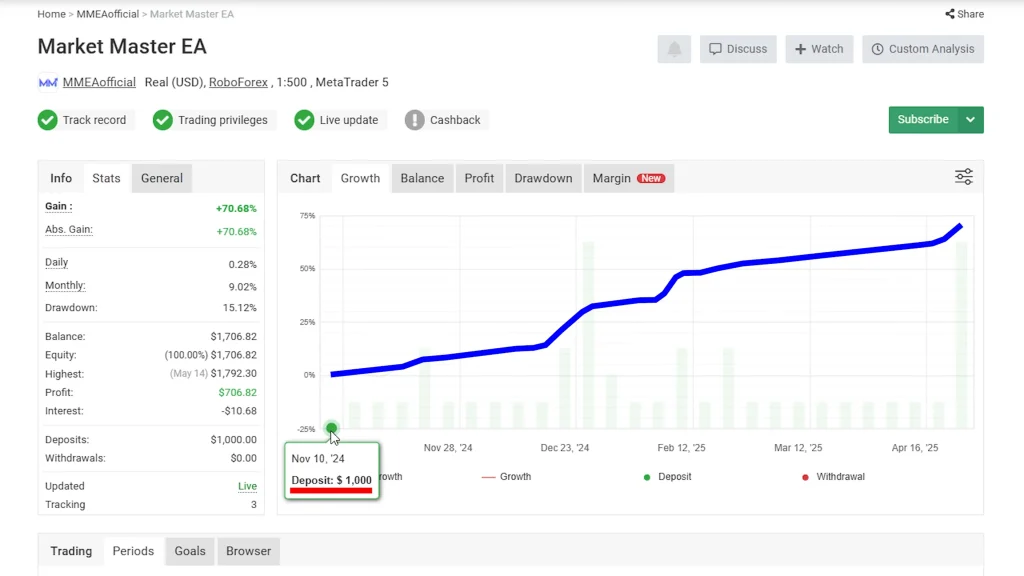
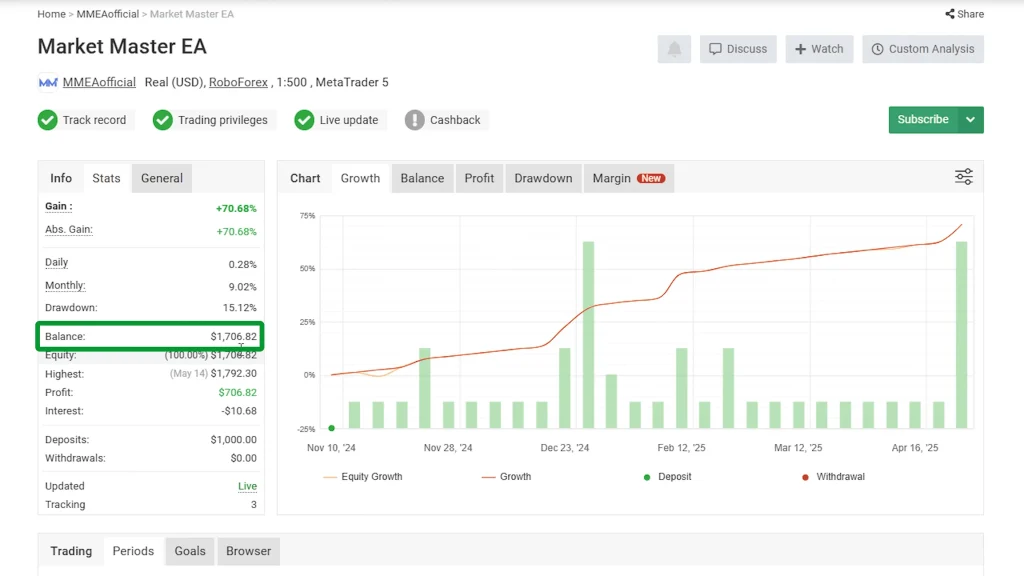
The vendor also maintains a verified MyFXBook account, which adds credibility. They’ve paid for live update verification, a detail that matters more than you might think. Many vendors skip this $50-60 expense, which makes result manipulation easier. The fact that Market Master’s developer invested in verification suggests confidence in real performance.
Their verified account started in November 2024 with $1,000 and currently sits at $1,700. Monthly breakdown shows:
- November 2024: 8%
- December 2024: 12%
- January 2025: 10%
- February 2025: 12%
- March 2025: 4%
- April 2025: 2%
- May 2025: 5%
That’s consistent with my testing. The EA produces steady returns without dramatic spikes or crashes. If the vendor had been using a Trading.com account, they would have already hit the 20% target and withdrawn $1,600 in profits.
Strategy Speculation: What’s Under the Hood
I can’t definitively say what trading logic Market Master uses since the code isn’t open-source. But based on chart observation and trade patterns, I think it’s primarily a price action system with possible Fibonacci integration.
The entries often occur at significant support or resistance levels. Long positions frequently trigger after support breaks and retests. Shorts activate near breached resistance zones. That’s classic breakout-retest methodology.
The 12-pip profit target is tight; this isn’t a system letting winners run indefinitely. It takes quick profits and moves on. Combined with the grid recovery mechanism, this creates a high win rate system where small, consistent gains accumulate over time.
Perhaps there’s also some form of trend-following element, given how the EA flips between long and short positions based on market direction. I noticed it doesn’t stubbornly fight trends; when EUR/USD is moving down, it takes short positions rather than continuously buying dips.
Risk Management and Position Sizing
Starting with 0.25 lots on a $10,000 account represents conservative sizing. That’s 0.0025% risk per standard lot, which gives enormous breathing room for the grid to work without threatening the account.
The doubling multiplier means potential exposure escalates quickly if all four grid levels activate:
- Level 1: 0.25 lots
- Level 2: 0.5 lots (cumulative 0.75)
- Level 3: 1.0 lot (cumulative 1.75)
- Level 4: 2.0 lots (cumulative 3.75)
On a $10,000 account, that maximum exposure of 3.75 lots is manageable but significant. Each pip movement at the full grid represents $37.50. A 100-pip adverse move would be $3,750, 37.5% of the account. However, the 50-pip grid spacing and 12-pip profit target mean the EA typically exits long before reaching full grid deployment.
I’ve seen the EA use two or three grid levels occasionally, but I haven’t witnessed a situation where all four levels were activated. That suggests the entry logic is selective enough to avoid completely wrong-sided trades most of the time.
Comparing Funded vs Live Account Economics
There’s an interesting calculation worth making. If you have $1,000 to invest in trading, should you:
- Open a standard live account with $1,000 capital, or
- Buy a $1,000 Trading.com challenge giving you $10,000 equity?
With the live account, you keep 100% of profits but trade smaller position sizes due to lower capital. With Trading.com, you access 10x the capital but face the 10% drawdown restriction and give up 20% of profits (after stage one).
Market Master’s low drawdown makes the funded account route attractive. You’re unlikely to breach the 10% limit based on historical performance. Once you hit the 20% target ($2,000 profit), you withdraw 80% ($1,600) while your account doubles for the next stage.
On a standard $1,000 live account, earning $2,000 means 200% returns, possible but requiring much higher risk than Market Master’s conservative approach would typically deliver.
The tradeoff is clear: funded accounts work best with low-drawdown systems. Aggressive EAs that might generate higher returns but with 20-30% drawdowns will repeatedly breach funded account limits.
What Makes This Different From Other Grid Systems
Grid-based EAs have a mixed reputation. Many blow accounts during strong trending markets because they keep adding positions against the trend until the margin runs out. Market Master avoids this through several mechanisms:
- Position Limits: The hard cap of four positions prevents runaway grid deployment.
- Selective Entry: Rather than trading constantly, the EA waits for setups that align with its logic. This reduces the frequency of deeply wrong-sided trades.
- Quick Profit Targets: Taking 12 pips and exiting means the system isn’t exposed to reversals that could wipe out open profits.
- Proper Spacing: 50-pip grid steps give each level room to breathe rather than cramming positions too close together.
The combination creates a grid system that retains the recovery benefits without the typical catastrophic risk. That’s reflected in the 3.42% maximum drawdown over 22 years, a number that simply wouldn’t exist if the grid management were flawed.
30-Day Money Back Guarantee and Vendor Credibility
Market Master comes with a 30-day refund policy, which provides some downside protection. If you purchase, test for a month, and find performance doesn’t match expectations, you can request your money back.
Not all EA vendors offer this, and those who do are generally more confident in their products. It eliminates the biggest risk, paying for software that immediately underperforms.
The verified MyFXBook tracking adds another credibility layer. Results are updated live and can’t be manipulated without detection. Combined with the money-back guarantee, the vendor demonstrates more transparency than average in this market.
Where to Access Market Master and Additional Resources
Market Master EA is available through Algo Trading Space, which provides access to the system along with additional trading resources and performance data. Full disclosure: we may earn a small commission if you purchase through our links, though this doesn’t affect the price you pay or the honest assessment in this review.
For serious automated traders, the Algo Trading Space VIP club offers exclusive access to live trading results across multiple EAs, early insights into new systems, and priority support. If you’re building a portfolio of expert advisors and want ongoing verified performance data beyond individual reviews, it’s worth exploring.
I’ll continue running Market Master on both demo and funded accounts, with all results publicly tracked. Transparency matters in this space, and I maintain that standard across everything I test.
Frequently Asked Questions
How does Market Master EA handle extended trending markets where grid systems typically struggle?
Market Master appears to address trending market risk through multiple safeguards. The four-position maximum prevents unlimited grid expansion, while the 50-pip spacing and selective entry logic reduce exposure to deeply wrong-sided trades.
Based on the 22-year backtest covering various trending periods, including 2008-2009 and 2014-2015, the system maintained its low drawdown even during strong directional moves. The 12-pip profit target also means positions exit quickly rather than remaining exposed to trend continuation that could reverse gains.
What account size do I realistically need to run Market Master safely with default settings?
The default configuration uses a 0.25 initial lot size, which works well on a $10,000 account as demonstrated in my testing. For smaller accounts, you’d need to adjust lot sizing proportionally, perhaps 0.02-0.05 lots on a $1,000 account.
The critical factor isn’t just account size but ensuring sufficient margin to handle all four grid levels if they activate. I’d recommend minimum of $5,000 for conservative 0.15-0.20 lot sizing, or $2,000-3,000 if you’re willing to start with 0.05-0.10 lots and accept slightly higher relative risk.
Does Market Master work on multiple currency pairs, or is it optimized specifically for EUR/USD?
Based on my testing, Market Master primarily trades EUR/USD, where I’ve seen the majority of activity and the strongest performance. The vendor’s materials don’t explicitly mention multi-pair capability, and my observation suggests the price action logic is specifically tuned for EUR/USD characteristics. Attempting to run it on other pairs without proper backtesting could produce different results.
If you want to trade additional pairs, I’d recommend thorough independent testing first rather than assuming the same parameters work universally.
How does the grid recovery mechanism actually work when trades go against the initial position?
When the first position moves 50 pips against you, Market Master opens a second position double the size (0.5 lots vs the initial 0.25). If price continues to be adverse, a third position opens another 50 pips away at 1.0 lot, then potentially a fourth at 2.0 lots.
All positions share a combined profit target; when the total unrealized P&L reaches the equivalent of 12 pips on the combined position size, everything closes. This averaging approach means you don’t need the price to return to your original entry; you just need enough reversal to hit the collective profit target.
What’s the realistic monthly return expectation, and how does that compare to more aggressive EAs?
Market Master targets around 2% monthly based on both my demo testing and the vendor’s verified account history. That’s conservative compared to EAs promising 10-20% monthly, but those systems typically carry 15-30% drawdown risk. The tradeoff with Market Master is lower returns in exchange for exceptional capital preservation (3.42% max drawdown historically).
For funded account challenges with strict drawdown limits, this profile is actually advantageous. For personal accounts where you prioritize steady compounding over quick gains, 2% monthly with minimal drawdown can outperform aggressive systems over multi-year timeframes.