 Petko Aleksandrov
Backtest results differ from live trading because a backtest is a simulation, not a replay of the exact execution environment. Differences usually come from historical-data quality, unrealistic fill assumptions, spread and slippage, latency, market regime changes, overfitting, trading costs, and human intervention. The gap can be reduced through out-of-sample testing, walk-forward analysis, realistic cost modeling, demo validation, and small-scale live deployment.
That’s the short answer. The rest of this piece works through each cause individually, plus a few practical tools, a bias checklist, a staged validation framework, and a diagnostic table, that help you figure out which specific gap is affecting your own strategy rather than treating the whole thing as one vague mystery. I’ve had this exact experience myself, a strategy that looked genuinely strong in testing, then limped along for its first month live. Turned out to be a mix of two or three factors stacking on top of each other, not one dramatic failure, which is honestly the more common pattern than people expect.
Data and Intrabar Sequencing
This is often where the divergence starts, quietly, before a single live trade is even placed.
Tick Data vs Bar Data
Many backtests run on bar data, open, high, low, close for each candle, rather than tick-by-tick price movement. That’s a real simplification. A one-minute candle with a wide range could have moved in any number of paths to get from open to close, and a backtest using only the bar’s four data points has to assume some intrabar order, commonly open then low then high then close, or a similar convention. If your strategy’s entry or stop depends on which extreme got touched first, that assumption can flip a winning trade into a losing one, purely based on a guess the backtest engine made silently.
Tick data reduces uncertainty about the sequence of price changes, but it does not automatically reproduce the liquidity, queue position, routing, and fill conditions that existed in the live market. It’s a meaningful improvement over bars, not a complete solution. Tick data records individual quote or trade updates from a particular feed, providing more detail than OHLC bars, but its completeness and representativeness still depend on the source. A retail broker’s tick feed reflects quoted changes from that specific broker or provider, not necessarily every trade or quote happening across the wider market, and it may still omit full order-book depth, hidden liquidity, queue position, and other participants’ actual fill probability.
Historical Data Gaps and Quality Issues
Beyond tick-versus-bar, the historical data itself isn’t always clean. Feeds can have gaps, especially around illiquid hours or provider outages, and different data vendors can show meaningfully different historical prices for the same instrument, since each aggregates from a somewhat different set of sources. A quick habit worth adopting: spot-check a handful of dates in your historical data set against a second, independent source. If prices line up closely, that’s reassuring. If they diverge meaningfully around known volatile events, that’s a signal your backtest results may be resting on shakier ground than the clean equity curve suggests.
Execution and Fill Assumptions
Here’s the part that surprises traders most, since it’s invisible in a backtest unless the engine specifically models it.
Not All Backtests Are Equally Simplistic
Simplified backtests often assume immediate fills at the observed or next available price, with no delay, no rejection, and no partial fills. More advanced simulators can model latency, bid-ask spread, partial fills, queue position, and variable transaction costs, but their realism still depends entirely on the data and assumptions supplied to them. A sophisticated simulator fed unrealistic assumptions produces just as misleading a result as a simple one, so the engine’s capability matters less than whether you actually configured it to reflect real conditions.
How Much Execution Matters Depends on Your Strategy
Execution differences are often a major source of divergence, especially for short-horizon strategies like scalping or high-frequency systems, where entry timing down to the tick genuinely changes outcomes. For slower systems, holding positions for hours or days, the dominant issue may instead be overfitting, regime change, look-ahead bias, or other factors covered further down this article. Their relative importance depends on the system’s holding period, order type, turnover, and the specific market, so treat execution as one strong candidate among several, not automatically the answer.
Demo Trading Isn’t the Same as Real Execution
This distinction matters more than most traders realize. Forward testing on a demo account exposes the strategy to unseen real-time prices and operational conditions, which is genuinely useful, but fills may still be simulated. Demo environments often model fills, slippage, liquidity, rejections, and order priority using their own internal assumptions, which may use real-time prices without replicating the same execution environment a funded live account actually experiences. A small live test, trading modest size with real capital, is usually needed to measure broker-specific slippage and execution behavior that demo trading can approximate but not fully replicate.
Costs Omitted From Backtests
Trading frictions extend well beyond spread and commission, and a surprising number of backtests leave several of these out entirely.
Beyond the obvious spread and commission, live results can differ because of forex rollover or swap charges on positions held overnight, margin interest, stock borrow fees and hard-to-borrow restrictions for short positions, dividend adjustments, exchange fees, data feed subscription costs, and platform fees. None of these are exotic, they’re routine costs of actually running a strategy, yet a backtest built only around spread and a flat commission estimate can understate the real cost of trading by a meaningful margin, especially for strategies that hold positions overnight or trade instruments with borrow restrictions.
Slippage assumptions baked into a backtest, if there are any at all, tend to be optimistic too. A flat few pips added as a rough estimate might approximate slippage during a calm session and badly underestimate it during a fast-moving one. A reasonable fix is modeling slippage as a range rather than a flat number, wider during known high-volatility windows and around scheduled news, tighter during calm, liquid sessions.
Backtest Biases That Can Make Results Look Better Than They Are
Beyond execution and cost gaps, several well-known biases can make historical performance look stronger than any live strategy could actually achieve.
| Bias | What It Does |
| Look-ahead bias | Uses information that was not available at trade time |
| Survivorship bias | Tests only instruments that still exist today |
| Data snooping | Repeatedly searches until chance patterns look significant |
| Selection bias | Chooses favorable markets or periods after seeing results |
| Incorrect fill logic | Assumes orders fill when live liquidity may not have supported them |
| Corporate-action error | Mishandles splits, dividends, or delistings in the data |
| Time-zone error | Misaligns bars, sessions, or news timestamps |
Any one of these can quietly inflate a backtest without the trader noticing, since the equity curve still looks clean and plausible on the surface. Look-ahead bias in particular is easy to introduce by accident, for example calculating an indicator using a full day’s data and then testing as if that value were known at the start of the day. Worth reviewing your own backtest logic against this list before trusting the headline numbers.
Market Regime Change
Even a perfectly executed backtest, built on flawless data with every bias accounted for, faces one more problem: the market it was tested on isn’t the market you’re trading now.
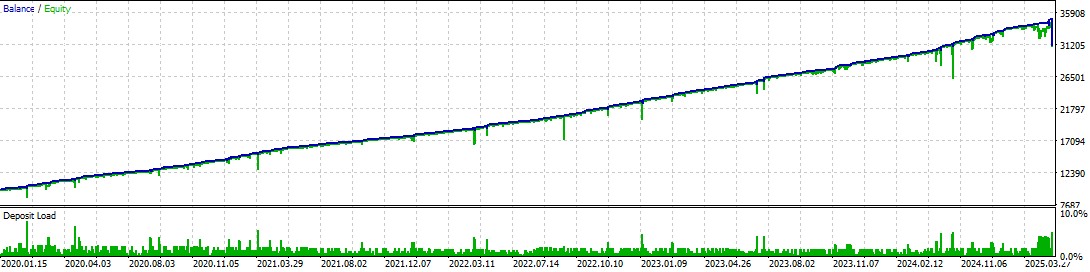
Every backtest is tested against a specific historical period, and that period had its own character, trending or ranging, volatile or calm, a particular macro environment. A strategy tuned to perform well in that regime can underperform once conditions shift, and markets do shift, sometimes gradually, sometimes abruptly. A trend-following strategy backtested through a strongly trending year, for instance, might show excellent results that owe more to the year itself than to the strategy’s actual edge. This isn’t a flaw in the backtest exactly. It’s the honest limit of testing on the past to predict a future that hasn’t happened yet.
Overfitting and Parameter Instability
A related and sneakier problem is overfitting, where a strategy’s rules get tuned so precisely to historical data that they capture noise specific to that period rather than a genuine, repeatable edge. An overfit strategy can look spectacular in a backtest and then fall apart almost immediately live, since the very specificity that made it look good was actually the problem.
Parameter instability is a close cousin of this. If small changes to a strategy’s parameters, a slightly different moving average length, a marginally different stop distance, produce wildly different backtest results, that instability is a warning sign. A genuinely robust edge tends to survive minor parameter tweaks reasonably well. One that collapses the moment you nudge a setting is probably fitted to specific historical noise rather than a real, repeatable pattern.
Position Size and Market Impact
Here’s a factor that’s easy to overlook entirely if you’ve only ever tested small size: a strategy can match its backtest closely at small size and deteriorate noticeably as size grows.
Most backtests assume unlimited liquidity at the displayed price, filling any order size instantly at the quoted level. Live markets don’t work that way once your order size grows meaningfully relative to available liquidity. Larger orders may consume multiple price levels rather than filling at one, take longer to fill, or reveal their presence to the market in ways that move price against you before the order completes. This is especially relevant for thin instruments and high-turnover systems, where even a modest increase in position size can start eating into the edge a smaller backtest never had to account for. Capacity, essentially how much size a strategy can absorb before performance degrades, should be tested separately from the strategy’s core logic, not assumed to scale linearly forever.
Human Intervention
Even a fully automated strategy isn’t entirely free of the human element, and this gap gets overlooked constantly.
Trading frictions include the discomfort of watching a real drawdown happen with real money attached, which can tempt a trader to intervene, pause the system, or tweak a parameter mid-drawdown in a way that never happened during a clean, emotionless backtest run. A backtest doesn’t include this variable at all, since there’s no discomfort to react to when the numbers already happened months ago. Even with automation, someone’s usually watching, and that someone can quietly undo a strategy’s edge by deviating from it under pressure. I’ve caught myself doing exactly this, watching a live equity curve dip below what the backtest showed as a normal drawdown, and feeling the urge to shut the system off “just to be safe.” Predefining clear rules for when a pause or override is actually warranted, before you’re in the emotional moment, is the most reliable defense against this.
A Staged Validation Framework
Backtesting, out-of-sample testing, walk-forward testing, demo forward testing, and small-capital live testing are not interchangeable steps, they each answer a different question, and skipping straight from a backtest to full live size skips several of them entirely.
| Stage | Purpose |
| In-sample backtest | Develop the hypothesis |
| Out-of-sample test | Check whether it generalizes to unseen data |
| Walk-forward test | Test repeated recalibration across time |
| Demo forward test | Validate logic and operational stability in real time |
| Small live deployment | Measure actual fills, slippage, fees, and broker behavior |
| Scaled deployment | Increase size only after live assumptions remain stable |
Each stage exists because the previous one couldn’t answer the next question. An in-sample backtest tells you the hypothesis is worth pursuing. It doesn’t tell you whether it generalizes, which is what out-of-sample and walk-forward testing are for. Demo trading validates the logic operationally. It doesn’t measure your specific broker’s real slippage, which is what a small live deployment is for. Skipping stages doesn’t save time so much as defer the discovery of a problem to a point where it’s more expensive to fix.
How to Measure Whether the Gap Is Acceptable
Rather than expecting live results to match a backtest exactly, or panicking at the first sign of divergence, it helps to compare live performance against a range rather than a single line.
Useful metrics to track and compare between backtest and live include trade count difference, fill-rate difference, average slippage, average spread, expectancy, profit factor, win rate, average win and loss size, maximum drawdown, trade duration, missed-signal rate, and rejected-order rate. Compare live results with a confidence range rather than a single backtest line. Track whether live trade frequency, average cost, expectancy, and drawdown remain within the distribution produced by out-of-sample and Monte Carlo testing, rather than expecting them to match one specific historical curve exactly.
Why Monte Carlo Analysis Helps Here
A single backtest produces one specific sequence of trades, in one specific order. Monte Carlo simulation, reshuffling that trade sequence repeatedly, or varying cost assumptions across many runs, produces a range of plausible outcomes instead of one. This matters because many traders mistake their single historical trade sequence for the expected future equity path, when in reality that exact sequence was always just one of many paths the strategy could plausibly have taken. Live results that fall within the range Monte Carlo analysis suggests is normal are consistent with the strategy working as intended, even if they don’t match the original backtest curve point for point.
Diagnosing a Specific Gap
If you’re seeing a specific symptom in live trading, here’s a starting point for narrowing down the likely cause before you assume the whole strategy is broken.
| Symptom in Live Trading | Likely Cause | What to Test |
| Fewer trades than the backtest | Data-feed or signal-timing differences | Compare timestamps and input data |
| Worse entry prices | Slippage or latency | Log decision price and fill price |
| Limit orders rarely fill | Unrealistic backtest fill logic | Model touch-versus-fill probability |
| Drawdown is deeper | Cost underestimation or regime change | Recalculate expectancy after live costs |
| Performance collapses immediately | Overfitting or look-ahead leakage | Re-run out-of-sample tests |
| Results worsen as size grows | Market impact or liquidity limits | Test smaller size and depth |
| Demo works, live fails | Simulated fills or broker-specific execution | Run a small live account |
| Manual changes hurt performance | Human intervention | Predefine pause and override rules |
An Execution Log Worth Keeping
To actually gather the data this table asks for, it helps to log every trade with enough detail to reconstruct what happened. A useful log tracks the signal timestamp, confirming when the strategy actually acted, the expected entry price as a baseline for measuring slippage, the submitted order type, the fill timestamp to measure latency, the fill price to measure execution cost, the spread at submission to capture market condition, the order’s status including any rejection or partial fill, the broker or venue used, the strategy version, since comparing results across different code versions muddies the analysis, and a note on the broader market regime at the time. None of this needs elaborate software. A spreadsheet updated after every trade covers it, and it turns a vague sense of “live feels off” into an actual, diagnosable pattern.
Frequently Asked Questions
How much difference between backtest and live results is normal?
There’s no universal number, since it depends on the strategy, the market, and how carefully the backtest modeled real conditions. Rather than expecting an exact match, compare live trade frequency, average cost, expectancy, and drawdown against the range produced by out-of-sample and Monte Carlo testing, not against the single historical equity curve. A large, unexplained divergence outside that expected range is the real warning sign, not any small gap on its own.
Can a backtest ever fully predict live performance?
No, and it’s worth not expecting that from any backtest, however carefully built. A backtest tests a hypothesis against the past, while live trading unfolds against conditions that haven’t happened yet, including future news, liquidity shifts, and broker-specific execution quirks. The goal of a good backtest isn’t a perfect prediction, it’s a reasonably modeled estimate paired with staged validation, out-of-sample testing, demo trading, and a small live deployment, to catch what the historical test couldn’t.
Does automated trading close the gap between backtest and live results more than manual trading?
Partially, but not entirely. Automation removes manual entry delay and emotional hesitation at the point of execution, which helps. It doesn’t remove slippage, data quality issues, capacity limits as size grows, or the risk that market conditions have shifted since the backtest period. An automated system can also still be paused or altered by the person overseeing it during a stressful drawdown, which reintroduces the same human factor a backtest never modeled.
Should I distrust a backtest that shows very strong results?
Not automatically, but treat unusually strong results as a reason to look closer rather than celebrate immediately. Extremely strong performance is sometimes a sign of look-ahead bias, survivorship bias, data snooping, or unrealistic fill assumptions rather than a genuine edge. Check whether costs were modeled realistically, whether the test spanned multiple market regimes, and whether small parameter changes cause the results to collapse, since that instability often points to overfitting rather than a repeatable pattern.
Why does a strategy work on demo but fail on a live account?
This usually comes down to execution, not logic. Demo environments often simulate fills, slippage, and order priority using their own internal assumptions, which can differ meaningfully from how a specific broker actually fills orders on a funded account. The strategy’s decision-making may be working exactly as intended while the fills themselves are simply better on demo than in live conditions. A small live test, even at minimal size, is usually the only reliable way to measure your actual broker’s execution behavior.
Final Checklist
Before trusting a backtest enough to trade it live at meaningful size, it’s worth running through a short list:
- Has the data been checked for quality and gaps?
- Have fills and costs been modeled realistically rather than assumed instant and free?
- Has the strategy been tested out-of-sample and across more than one market regime?
- Has parameter stability been checked?
- Has capacity been tested separately from logic at increasing size?
- Has a demo run validated operational stability?
- Has a small live deployment measured your actual broker’s execution before scaling up?
None of this guarantees a strategy will perform identically live. It does mean any gap that shows up afterward is one you can actually diagnose, using the table above, rather than one you’re left guessing about.
Backtesting and forward testing are research tools, not guarantees of future performance. Historical results, however carefully modeled, never guarantee what a strategy will do in live markets, and market conditions can shift in ways that invalidate a previously reliable edge. Trade with capital you can afford to lose, and treat every backtest as a starting hypothesis to validate through staged testing, not a finished conclusion.