 Petko Aleksandrov
Risk warning: Leveraged products carry substantial risk to your capital. No automated system guarantees profitable results, and the figures discussed below come from historical simulation rather than a live account. Test on a virtual account first.
The Direct Answer
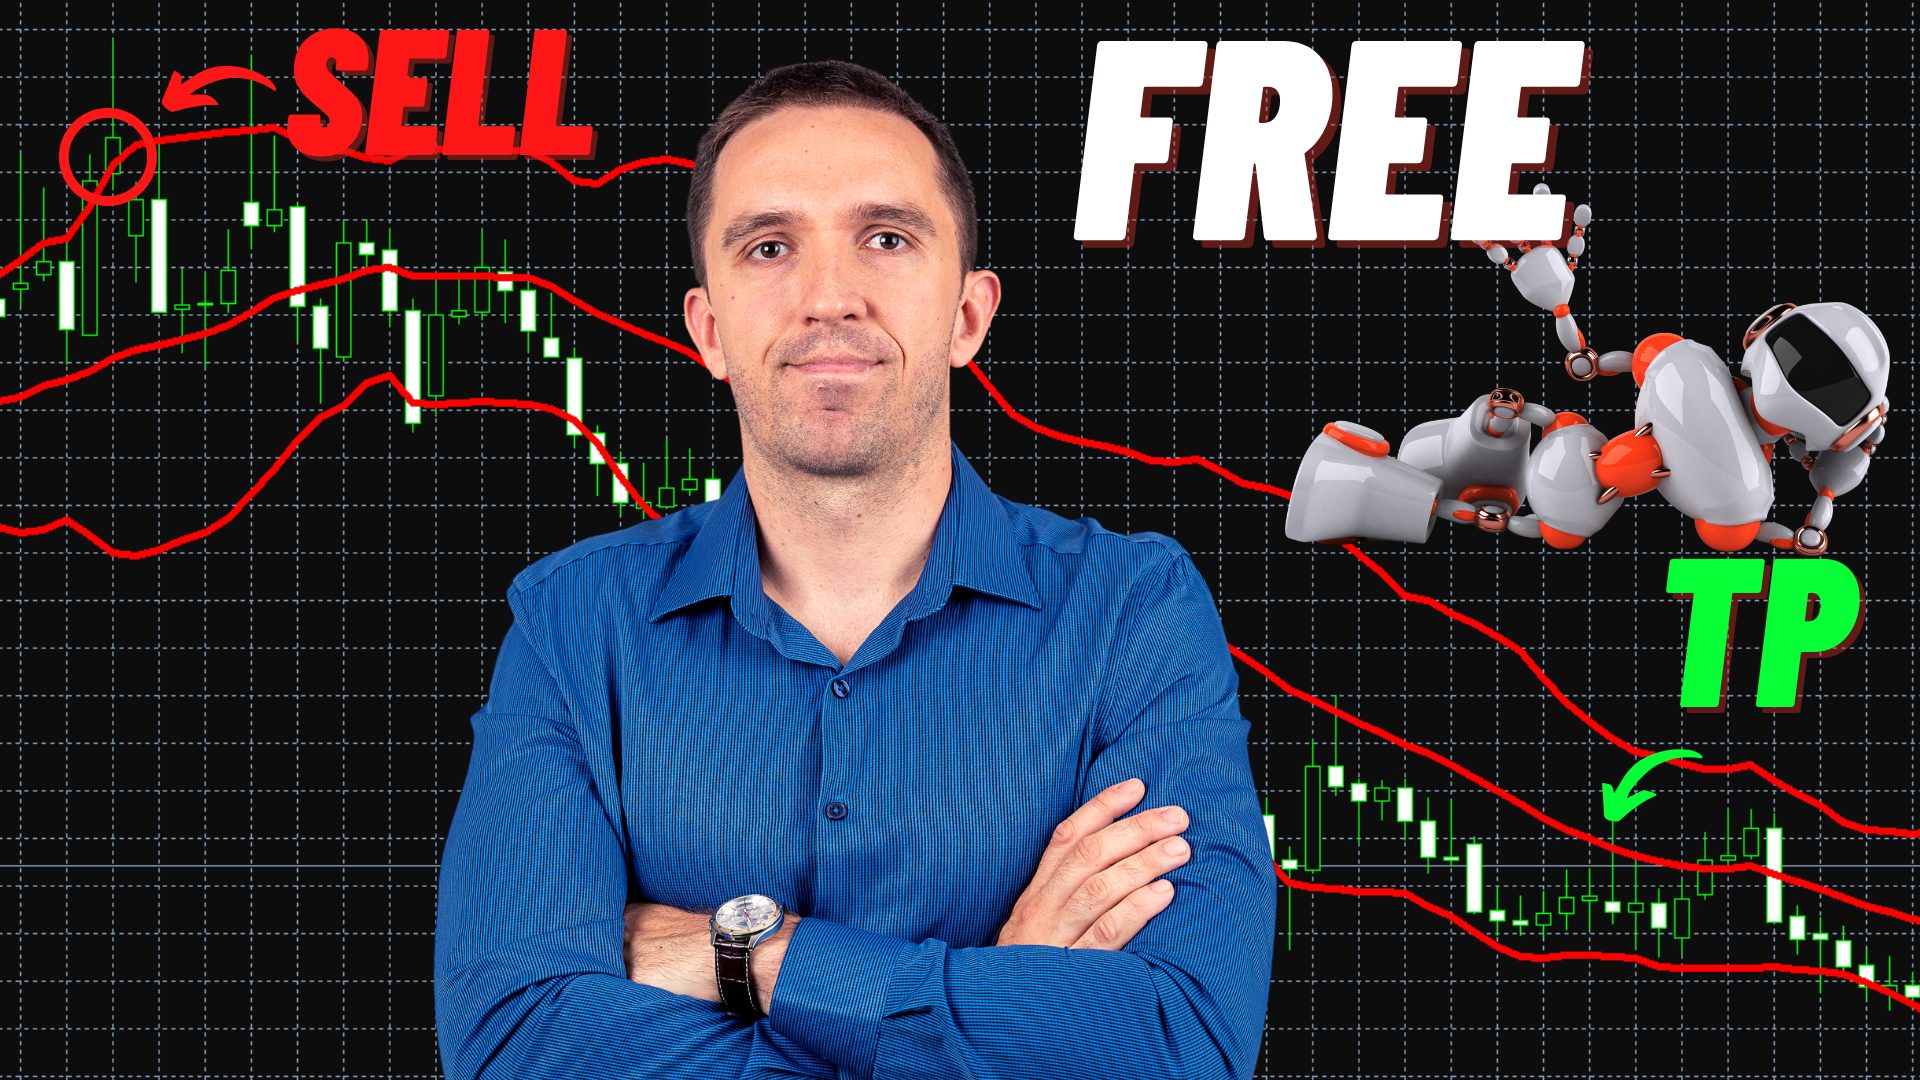
I take a Bollinger Bands setup, write its conditions as code an Expert Advisor can evaluate, then let that file watch the market on completed candles instead of watching it myself.
Three indicators do the work. The bands produce the signal, the Awesome Oscillator confirms it, and Envelopes handle one of the three possible exits. The file goes into the MQL4 Experts folder, gets compiled through the Navigator panel, then attaches to a EURJPY H1 chart and starts trading.
Everything below covers the exact trading conditions, the input values, installation, backtesting, and a section on what this system has not demonstrated. That last part matters, because the earlier version of this page called the results outstanding without publishing a single figure.
Indicator Inputs
Three indicators, one chart, and none of them use their default configuration.
| Indicator | Parameter | Value |
| Bollinger Bands | Period | 13 |
| Bollinger Bands | Deviation | 1.87 |
| Awesome Oscillator | None | No parameters exist |
| Envelopes | Period | 27 |
| Envelopes | Deviation | 0.66 |
| Chart | Symbol | EURJPY |
| Chart | Period | H1 |
Defaults of 20 and 2 on the bands would produce something quite different, so check what your platform loaded before assuming anything matches.
The Awesome Oscillator carries no configuration at all. It draws a histogram around a zero line, green when momentum builds and red when it fades, and there is nothing to adjust.

The Long Rules
Original wording described the entry as a candle opening above the lower band after one opened below it. Accurate as far as it went, though it left several questions unanswered, which is why the rules below spell out timing explicitly.
| Component | Long condition |
| Signal candle | Previous completed candle opened below the lower Bollinger line |
| Trigger candle | Current candle opens back above that line |
| Confirmation | Awesome Oscillator reading higher than the preceding bar |
| Order timing | At the open of the triggering candle |
| Protective exit | 90 pips below entry price |
| Target | 100 pips above entry |
| Indicator exit | Price moves above the upper Envelopes line, then a candle opens back inside |
| Which exit applies | Whichever condition arrives first |
Definition matters on the confirmation. Ascending means the current histogram value exceeds the previous one, evaluated on completed bars only. Not two consecutive rising bars, not a colour change, not a position relative to zero. One comparison, one bar back.
I watched a textbook band signal fire during recording where the oscillator was falling rather than rising. No trade taken. That filter rejects a fair proportion of otherwise attractive-looking setups, which is the entire reason it exists.
The Short Rules
Mirrored, with one correction worth flagging.
| Component | Short condition |
| Signal candle | Previous completed candle opened above the upper Bollinger line |
| Trigger candle | Current candle opens back below that line |
| Confirmation | Awesome Oscillator reading lower than the preceding bar |
| Order timing | At the open of the triggering candle |
| Protective exit | 90 pips above entry |
| Target | 100 pips below entry |
| Indicator exit | Price moves below the lower Envelopes line, then a candle opens back inside |
| Which exit applies | Whichever condition arrives first |
Here is the correction. The 2023 version stated the protective exit sits 90 pips above entry and the target 100 pips below, presented as though that applied universally. Those figures describe a short position only.
Where did they come from? A worked example from the original recording: a short entered around 146.64, protective level at 147.54, target at 145.64. Do the arithmetic and both distances check out for a downward position. Applied to a long, the same instruction would place your protective level above your entry and your target below it, which reverses the logic entirely and would produce a loss on every winning move.
Anyone who copied those numbers literally into a long setup deserves an apology, and gets one here.
The Envelopes Exit

Three exits exist and any of them can close a position. First to trigger wins.
The indicator-based one works like this: price pushes beyond the outer line in your trade’s direction, then pulls back, and the first candle opening inside the channel closes you out.
Sometimes it beats the fixed target substantially. In the recorded example, letting the channel manage the exit would have captured more than the 100-pip target did, because price kept running after the target level had already been passed. Other times the reverse happens and you give back gains a fixed target would have banked.
Which is better? I genuinely don’t know, and I’d distrust anyone claiming certainty without testing both variants separately across a large sample. My instinct leans toward the indicator exit on this pair, though instinct is exactly what automation exists to remove.

Position Sizing and Exposure
Absent from the original article entirely, which was an oversight.
Fixed distances make sizing arithmetic straightforward:
- Choose the maximum fraction of your balance to risk per trade. Something conservative.
- Your protective distance is 90 pips, fixed.
- Divide your risk amount by 90 to get value per pip.
- Convert that into volume using the pip value for EURJPY on your account currency.
Additional limits worth setting before anything runs live:
- One trade at a time per chart: Stacking signals multiplies exposure without multiplying edge.
- A maximum spread filter: Skip entries when conditions are unusually wide.
- A daily loss ceiling: Halt after a defined drawdown rather than letting a bad session compound.
- Awareness of scheduled releases: Yen pairs move sharply around Bank of Japan announcements.
Reward against risk here is 100 to 90, which is barely above one. That ratio means the system needs a win rate comfortably above half to survive costs, and it’s the first thing I’d examine in any test report.

How the EA Was Built
Straight answer: it was generated rather than hand-coded, then reviewed. The conditions above translate cleanly into machine logic because each one is a comparison between two numbers on completed bars, which is precisely the sort of thing generators handle well.
What that means practically: no MQL4 knowledge is needed to run it, though you would need some to modify it. Compiled files cannot be meaningfully edited, so anyone wanting to adjust the protective distance or swap the confirmation indicator needs source code rather than the compiled version.
Loading It Into MetaTrader 4
- Open the platform, then File, then Open Data Folder.
- Go into MQL4, then Experts.
- Paste the file there.
- Return to the platform, right-click Expert Advisors in the Navigator panel, choose Refresh. This compiles it.
- The name appears in the list once compilation succeeds.
- Open a EURJPY chart on H1.
- Drag the file onto that chart.
- Review the input values in the dialog that appears, then confirm.
- Permit algorithmic trading in Tools, then Options, then the Expert Advisors tab.
- Switch on the AutoTrading button in the toolbar.
- Check the chart corner shows a smiling face rather than a frowning one.
- Open the Experts tab in the Terminal window and read the log for errors.
Steps eleven and twelve get skipped constantly. A frowning face means nothing will execute regardless of how correct your rules are, and the log tells you why in plain language.
Wrong chart or wrong period produces results bearing no relationship to anything tested. Sounds too obvious to mention. Happens weekly.
Running a Backtest
Open the Strategy Tester through the View menu, select the file, then work through the configuration.
| Field | What to set |
| Instrument | Your broker’s EURJPY, exact name including any suffix |
| Period | H1 |
| Model | Every tick, despite the wait |
| Date range | As far back as your data allows |
| Spread | Current, or a pessimistic fixed figure |
| Deposit | Something realistic for your situation |
| Volume | Matching the sizing you calculated earlier |
Press Start, wait, then open the Report tab for the full statistics.
Two points about the model selection. Open prices only runs quickly and evaluates conditions once per bar, which suits this system reasonably well since entries occur at candle opens. It does not simulate what happens inside a bar, though, and both the protective level and the target sit inside bars. Use every tick when it matters, which here it does.
Data quality also caps what a simulation can tell you. Sparse history produces gaps the tester fills by interpolation, inventing movement that never occurred.
What This System Has Not Demonstrated
The original page described the EA as efficient and capable of outstanding outcomes. Neither claim was supported, and both are gone.
Here is what the source material actually establishes: a balance curve described as stable across roughly fifteen years, with somewhat more than 300 trades across that span.
Now look at those two numbers together, because their relationship is the interesting part. Three hundred entries across fifteen years averages around twenty per year, or fewer than two monthly. For an hourly chart, that is remarkably infrequent, and it tells you the confirmation filter rejects the overwhelming majority of band signals.
Thin counts cut both ways. Fewer entries mean lower cumulative trading costs, which helps. They also mean any statistic calculated from them carries wide uncertainty, and a smooth-looking equity curve built from 300 outcomes across fifteen years is considerably less convincing than the same shape built from 3,000.
What was never published:
| Missing figure | Why it matters |
| Test start and end dates | Fifteen years covers wildly different regimes |
| Broker and data source | Feed quality changes results |
| Initial deposit | Turns currency amounts into percentages |
| Volume used | Determines whether figures scale to your account |
| Net profit | Absent |
| Profit factor | Absent |
| Win rate | Critical, given the reward ratio sits near one |
| Maximum drawdown | The number deciding whether you could hold through |
| Average result per trade | Reveals whether costs consumed the edge |
| Spread and commission assumed | On a yen cross, spread varies considerably |
| Slippage | Simulations often assume none |
| Out-of-sample segment | Separates a genuine edge from a fitted one |
| Forward-test record | No demo or live comparison exists |
Run your own test and you will have better evidence than I published, which is not a high bar. The table above lists what to record.
Why This Combination Rather Than One Indicator
Fair question, and the answer is partly historical rather than analytical.
Band-touch systems on their own generate a great many signals, most of which go nowhere. Price spends plenty of time outside the channel, particularly during directional moves, and buying every return inside it means buying into declines repeatedly. Anyone who has watched a mean-reversion setup during a strong trending phase knows the feeling.
Adding momentum confirmation filters those out. The oscillator comparison asks a simple question before each entry: is short-term momentum currently moving toward the direction I’m about to take? When the answer is no, nothing happens, and the earlier example from the recording showed exactly that case, with a clean band signal rejected because the histogram was falling rather than rising.
The channel exit then addresses a separate weakness. Fixed targets close positions mechanically at a set distance regardless of whether a move still has momentum behind it, and on a pair capable of extended runs that leaves gains on the table. Letting the outer line manage the exit adapts to whatever the move actually does.
Three conditions, three different jobs. Whether the combination beats any single one of them is untested, which I’ll say again because it’s the honest position.
Optimization and the Overfitting Trap
Worth understanding before you start adjusting values.
The parameters here are unusual: period 13 rather than 20, deviation 1.87 rather than 2, Envelopes at 27 and 0.66. Those are not round numbers, and non-round numbers usually mean somebody searched for them.
Searching is not automatically wrong. Every parameter has to come from somewhere. The danger is that any search across enough combinations will find something that fits past data beautifully while capturing nothing repeatable.
Signs your optimization went too far:
- Small parameter changes produce large performance swings. Robust configurations degrade gently.
- The chosen value sits on a lonely peak rather than inside a broad plateau of decent results.
- Performance collapses on data the search never touched.
- The system works on one pair and nowhere else.
Practical defence: reserve a chunk of history the optimizer never sees, then check performance there separately. Also test neighbouring values. If period 13 works and 12 or 14 fall apart, you found noise rather than structure.
Demo First, Then Small
One habit I’d argue for regardless of what any report shows.
Backtest on your own broker’s data rather than trusting figures produced elsewhere, because spread and execution vary enough between firms to change the outcome meaningfully. Once your own simulation looks acceptable, move to a virtual account and leave it there long enough to see real signals arrive under current conditions.
Only then consider live capital, and start smaller than feels worthwhile. The first months of live running teach you things no simulation surfaces: how wide the spread gets at rollover, how often fills land away from the modelled price, whether your connection actually holds overnight.
Common Errors and Fixes
| Symptom | Likely cause |
| Name missing from Navigator | Wrong folder, or Refresh not clicked |
| Frowning face on the chart | AutoTrading off, or live trading disabled in properties |
| Nothing opening for days | Normal here, given roughly twenty entries per year |
| Log shows invalid volume | Size below your broker’s minimum, or too many decimals |
| Log shows invalid stops | Protective distance inside the broker’s minimum stop level |
| Backtest looks unrealistically smooth | Modelling mode too coarse, or spread set to zero |
| Live results diverge from testing | Slippage, spread widening, and execution delay |
That last row deserves emphasis. Simulated fills happen at the modelled price. Real ones don’t, particularly around news, and a system with a reward ratio near one has little margin to absorb the difference.
Frequently Asked Questions
Can it run on pairs other than EURJPY?
Technically yes, though the parameter values were derived for that pair specifically and there is no reason they should transfer. Pip values, typical daily ranges, and session behaviour all differ between instruments, so a 90-pip protective distance representing a modest move on one cross might represent an enormous one elsewhere. Test each pair separately, treating it as a fresh system rather than an extension of this one, and expect different optimal values.
Why period 13 rather than the standard 20?
Shorter lookback periods make the channel respond faster to recent price behaviour, producing more frequent boundary touches and tighter lines. Combined with a deviation of 1.87 instead of 2, the bands sit slightly closer to price than the conventional configuration. Whether this specific pairing holds any advantage over defaults was never tested comparatively, so treat it as one configuration among many rather than an established improvement.
Does the system trade during news releases?
No filter for scheduled announcements exists in this version. Yen crosses react sharply to Bank of Japan decisions and to US data affecting the dollar leg indirectly, producing gaps that can jump past protective levels entirely. Anyone running this live should either add a calendar filter or switch off manually before major releases. I do the second, which is less elegant and requires remembering, but it works.
How long before I know whether it works?
Longer than most people expect, because roughly twenty entries annually means a full year of trading produces a sample too small for confident conclusions. Judging market performance across three months would be close to meaningless. Forward-testing on a virtual account for six months at minimum gives a reasonable starting picture, and even that yields only ten or so outcomes. Patience is not optional with infrequent systems.
What happens if my platform closes while a trade is open?
Your protective level and target already sit with the broker as server-side instructions, so they continue working. What stops is the Envelopes exit, since evaluating that condition requires the file running and reading current data. Anything that should have closed on the channel condition stays open until the fixed levels trigger instead. Hosting on a virtual private server avoids this gap entirely.
Is the reward ratio too low?
Risking 90 to make 100 is thin, and it means win rate carries most of the burden. Break-even before costs sits around 47 percent, and adding spread plus commission pushes the requirement higher still. Trading systems with wider targets tolerate lower accuracy. Neither structure is superior in principle, though thin ratios leave less room for execution slippage, which is precisely where live results tend to disappoint.
Can I change the fixed distances?
Only with source code, since compiled files resist modification. Changing them invalidates every published result, so the full testing sequence needs rerunning afterward rather than assuming the previous figures still apply. Worth noting that protective distance and target interact with the indicator exit: widen the target enough and the channel condition closes nearly every trade first, which turns it into a different system.
Does using three indicators improve reliability?
Not automatically. Combining conditions reduces signal frequency, which explains the low position count, and fewer signals mean each one carries more weight in your results. Filters help when they remove genuinely poor setups and hurt when they simply remove setups. Distinguishing between those two cases requires testing each condition’s contribution separately, something the original material never attempted and I have not published either.
Disclosure: Broker links appearing elsewhere on this site may carry commercial arrangements. Educational content only, not a recommendation to trade or to use any particular provider. Backtest results describe past conditions and do not indicate future performance. Consider guidance from a regulated professional before committing capital.