 Petko Aleksandrov
Risk warning: Forex trading involves a high risk of loss. Indicators are analytical tools, not guarantees of profit. This guide is for educational purposes only and does not constitute financial advice.
Forex indicators help traders identify trends, momentum, volatility, and entry opportunities using price data. In this guide, you will learn the best forex indicators used by beginners and professional traders, including RSI, moving averages, MACD, Bollinger Bands, Fibonacci retracement, ATR, Stochastic, and Ichimoku Cloud, plus how to combine them into practical trading setups.
This guide is written by Petko Aleksandrov, founder of Algo Trading Space and EA Trading Academy. With over a decade of live trading experience across manual and algorithmic strategies, Petko has built and tested hundreds of indicator-based systems on real broker accounts. The live results, published transparently on Algo Trading Space, provide direct evidence of which indicator logic performs under actual market conditions.
Top 5 Best Forex Indicators: Quick List
For traders who want a fast answer before reading the full guide:
- RSI (Relative Strength Index): Best for identifying overbought and oversold conditions
- Moving Averages (SMA / EMA): Best for identifying trend direction and dynamic support/resistance
- MACD: Best for confirming trend strength and spotting momentum shifts
- Bollinger Bands: Best for measuring volatility and identifying breakout conditions
- Fibonacci Retracement: Best for finding high-probability entry zones within a trend
Forex Indicators Comparison Table
| Indicator | Type | Best Use Case | Skill Level | Available on MT4/MT5 |
| Moving Average (SMA/EMA) | Trend | Identify direction, dynamic support | Beginner | Yes |
| RSI | Momentum | Overbought/oversold signals | Beginner | Yes |
| MACD | Trend/Momentum | Confirm trend, spot reversals | Intermediate | Yes |
| Bollinger Bands | Volatility | Breakouts, squeeze setups | Beginner | Yes |
| Fibonacci Retracement | Support/Resistance | Entry zones within trends | Intermediate | Yes |
| ATR | Volatility | Stop-loss placement, position sizing | Intermediate | Yes |
| Stochastic Oscillator | Momentum | Short-term reversal timing | Beginner | Yes |
| Ichimoku Cloud | Trend/Support/Resistance | Full market structure view | Advanced | Yes |
| Parabolic SAR | Trend | Trailing stop guidance | Beginner | Yes |
| VWAP | Volume/Price | Intraday fair value reference | Intermediate | Yes (MT5/custom) |
| On-Balance Volume (OBV) | Volume | Confirm trend with volume | Intermediate | Yes |
| Pivot Points | Support/Resistance | Daily S/R levels | Beginner | Yes (custom) |
What Is a Forex Indicator?
A forex indicator is a mathematical calculation applied to price data (and sometimes volume) that helps traders analyze market conditions, identify potential entry and exit points, and confirm or filter trading signals. Indicators do not predict the future with certainty; they process historical price data and present it in a visual format that makes patterns, trends, and momentum easier to interpret.
There are four main categories of forex technical indicators, each serving a different analytical purpose. Most professional traders use a combination of at least two categories to avoid conflicting or redundant signals.
- Trend indicators show the direction and strength of the prevailing price movement. They help traders determine whether to look for long (buy) or short (sell) opportunities.
- Momentum indicators measure the speed and rate of price change. They are used to identify when a trend may be losing strength or when a reversal could be approaching.
- Volatility indicators measure how much the price fluctuates over a given period. They help traders calibrate position sizes, set stop losses, and identify breakout conditions.
- Volume indicators analyze the trading volume associated with price movements, helping traders confirm whether a trend has sufficient participation to be sustainable.
Trend Forex Indicators
Moving Averages (SMA and EMA)
Moving averages are the foundation of trend analysis in forex trading and are among the most widely used technical indicators across all markets and timeframes.
A Simple Moving Average (SMA) calculates the average closing price over a defined number of periods. For example, the 50-period SMA on the daily chart takes the average of the last 50 daily closing prices and updates with each new candle. The result is a smooth line that filters out short-term noise and shows the underlying direction of price.
An Exponential Moving Average (EMA) applies greater weighting to more recent prices, making it more responsive to recent market activity than the SMA. Because of this, the EMA reacts faster to price changes and is generally preferred by active traders.
How traders use moving averages:
When the price is trading above a moving average, the trend is considered bullish. When the price is below, it is considered bearish. The moving average itself acts as dynamic support in an uptrend and dynamic resistance in a downtrend. Many traders enter long positions when the price pulls back to and holds above a rising EMA, and short positions when the price bounces down from a falling EMA.
Common moving average periods:
- 20 EMA: Short-term trend, popular with day traders and scalpers
- 50 EMA/SMA: Medium-term trend, widely followed by swing traders
- 100 SMA/EMA: Intermediate trend reference
- 200 SMA/EMA: Long-term trend, used by institutional traders as a major directional filter
The Golden Cross and Death Cross are classic moving average signals. A Golden Cross occurs when the 50-period MA crosses above the 200-period MA, signaling a potential long-term bullish shift. A Death Cross is the opposite, where the 50 crosses below the 200, indicating potential bearish conditions.
MACD (Moving Average Convergence Divergence)
The MACD is one of the most popular trend-following and momentum indicators in forex trading. It was developed by Gerald Appel in the late 1970s and remains a core component of many professional trading strategies.
The MACD consists of three components: the MACD line, the signal line, and the histogram. The MACD line is calculated by subtracting the 26-period EMA from the 12-period EMA. The signal line is a 9-period EMA of the MACD line. The histogram shows the difference between the MACD line and the signal line.
How traders use MACD:
When the MACD line crosses above the signal line, it generates a bullish signal. When it crosses below, it generates a bearish signal. The histogram provides visual confirmation of momentum strength: bars expanding above the zero line indicate strengthening bullish momentum, while bars contracting suggest momentum is fading.
MACD divergence is one of the most useful applications of this indicator. When price makes a new high but the MACD fails to reach a new high (bearish divergence), it signals weakening momentum and a potential reversal. The opposite pattern (bullish divergence) can indicate a trend reversal to the upside.
Parabolic SAR
The Parabolic SAR (Stop and Reverse) was developed by J. Welles Wilder and is designed to identify trend direction and provide potential exit points. It appears as a series of dots above or below the price: dots below the price indicate an uptrend, while dots above indicate a downtrend.
Many traders use the Parabolic SAR as a trailing stop reference, adjusting their stop-loss as the dots move with the price. It works best in trending markets but generates frequent false signals in ranging or low-volatility conditions.
Momentum Forex Indicators
RSI (Relative Strength Index)
The RSI is one of the most widely recognized and used forex indicators globally. Developed by J. Welles Wilder in 1978, it measures the speed and magnitude of recent price changes to evaluate whether a currency pair is overbought or oversold.
The RSI is calculated on a scale of 0 to 100. A reading above 70 is traditionally considered overbought, suggesting the pair may be due for a pullback or reversal. A reading below 30 is considered oversold, suggesting a potential recovery.
How traders use RSI:
The most straightforward application is fading extreme readings: selling near 70 in a downtrend or buying near 30 in an uptrend. However, the RSI is most powerful when used to spot divergence. If EUR/USD makes a new high on price but the RSI fails to make a new high (bearish RSI divergence), this signals weakening momentum and increases the probability of a reversal.
In trending markets, the RSI can remain in overbought or oversold territory for extended periods without reversing, which is why most experienced traders use it as a filter alongside a trend indicator rather than as a standalone signal.
The default RSI period is 14, but many traders adjust this to 9 for more sensitive signals or 21 for smoother readings.
Stochastic Oscillator
The Stochastic Oscillator was developed by George Lane in the 1950s and is a momentum indicator that compares the closing price of a currency pair to its price range over a defined period. Like the RSI, it oscillates between 0 and 100.
Readings above 80 indicate overbought conditions. Readings below 20 indicate oversold conditions. The Stochastic consists of two lines: the %K line (the main stochastic reading) and the %D line (a moving average of %K, used as the signal line).
How traders use Stochastic:
A bullish signal is generated when the %K line crosses above the %D line in oversold territory (below 20). A bearish signal occurs when %K crosses % D below in overbought territory (above 80). The Stochastic is particularly effective on shorter timeframes for timing entries within an established trend.
It is often used alongside MACD or Fibonacci retracement levels for confirmation before entering a trade.
Volatility Forex Indicators
Bollinger Bands
Bollinger Bands were developed by John Bollinger in the 1980s and remain one of the most versatile volatility indicators available. They consist of three lines plotted on the price chart: a middle band (typically a 20-period SMA) and two outer bands set two standard deviations above and below the middle band.
The outer bands expand and contract based on market volatility. When volatility is high, the bands widen. When volatility is low, the bands narrow, forming what is known as a Bollinger Band Squeeze.
How traders use Bollinger Bands:
A squeeze followed by a sharp breakout in either direction can signal the beginning of a strong new trend. Traders watching for a squeeze will position themselves to enter in the direction of the breakout once it occurs.
Price touching the upper band does not automatically mean sell, nor does price touching the lower band automatically mean buy. In strong trends, price can “walk” along an outer band for extended periods. Bollinger Bands are most effective when combined with a momentum indicator such as RSI to confirm whether a touch of the outer band represents a reversal opportunity or a continuation signal.
ATR (Average True Range)
The Average True Range (ATR) was developed by J. Welles Wilder and introduced in his 1978 book “New Concepts in Technical Trading Systems.” It measures market volatility by calculating the average range between the high and low of each candle over a defined period, accounting for gaps between sessions.
ATR does not provide directional signals. It tells you how much a market is moving, not which direction it will move. A rising ATR indicates increasing volatility; a falling ATR indicates decreasing volatility.
How traders use ATR:
ATR is one of the most practical tools for setting stop losses and position sizes. A common approach is to set a stop-loss at 1.5 to 2 times the current ATR value, ensuring the stop is wide enough to survive normal market fluctuation without being so wide it creates excessive risk. For example, if the ATR on the 4-hour EUR/USD chart is 25 pips, a stop-loss of 37 to 50 pips would absorb normal price noise while protecting against a genuine adverse move.
ATR is particularly valuable for algorithmic traders and those building Expert Advisors, where consistent, data-driven stop-loss logic is required across different currency pairs and market conditions.
Volume Forex Indicators
On-Balance Volume (OBV)
On-Balance Volume (OBV) was developed by Joseph Granville and measures cumulative buying and selling pressure by adding volume on up-days and subtracting volume on down-days. In the forex market, where true volume data is decentralized, tick volume (the number of price changes per period) is used as a proxy for actual volume.
When OBV rises alongside price, it confirms that the trend has strong participation. When price rises but OBV fails to confirm (bearish divergence), it suggests the move may lack institutional support and could reverse.
Accumulation/Distribution
The Accumulation/Distribution indicator (A/D) builds on volume analysis by weighing each period’s volume based on where the price closed within its range. If the price closes near its high with strong volume, the A/D line rises (accumulation). If it closes near its low, the line falls (distribution).
Divergence between the A/D line and price is one of the most powerful signals it generates: if price is making new highs but the A/D line is falling, it suggests selling pressure beneath the surface.
VWAP (Volume-Weighted Average Price)
VWAP calculates the average price of a currency pair over a session, weighted by volume at each price level. It is a key reference for day traders and institutional participants, as it represents the average price at which all transactions for the day have occurred.
Many traders use VWAP as a dynamic support and resistance level during the trading day. Price above VWAP is generally considered bullish intraday; price below is bearish. VWAP resets at the start of each session, making it primarily a tool for intraday traders rather than swing or position traders.
Support and Resistance Indicators
Fibonacci Retracement
Fibonacci retracement levels are horizontal lines drawn between two significant price points (a swing high and a swing low) at the key Fibonacci ratios: 23.6%, 38.2%, 50%, 61.8%, and 78.6%. These levels often act as areas of support during pullbacks in an uptrend or resistance during rallies in a downtrend.
The 38.2%, 50%, and 61.8% levels are the most widely watched and respected. The 61.8% level in particular, known as the “golden ratio,” frequently acts as a strong reversal or continuation zone.
How traders use Fibonacci retracement:
In a defined uptrend, draw the Fibonacci tool from the swing low to the swing high. The retracement levels then identify potential areas where the pullback may find support and the trend may resume. Traders look for prices to pause, form a candlestick reversal signal, or show RSI divergence at these levels before entering in the direction of the trend.
Fibonacci retracement is most effective in trending markets with clearly defined swing points. In choppy, ranging markets, the levels are less reliable.
Pivot Points
Pivot Points are calculated from the previous session’s high, low, and close to project potential support and resistance levels for the current session. They are among the oldest and most widely used technical indicators in trading.
The central pivot point (PP) is the average of the previous session’s high, low, and close. Support levels (S1, S2, S3) and resistance levels (R1, R2, R3) are calculated as fixed distances from the PP. Many institutional traders and market makers use pivot points, which increases their significance as reference levels, particularly in liquid markets like EUR/USD and GBP/USD.
Best Forex Indicators for Beginners
Beginners should start with indicators that are straightforward to interpret, widely available on all platforms, and can form the basis of a complete, simple trading approach without overwhelming complexity.
- Moving Averages (20 EMA and 50 EMA): The simplest trend filter available. If the price is above both EMAs and the 20 is above the 50, the trend is bullish. This takes seconds to assess on any chart.
- RSI (14-period): Provides a clear overbought/oversold context with a simple 0-100 scale. Easy to combine with a moving average to filter entries.
- Bollinger Bands: Visual and intuitive. The squeeze pattern is easy to recognize, and the bands provide a natural reference for whether the price is at an extreme or near fair value.
- Stochastic Oscillator: A simple momentum tool that gives clear buy and sell crossover signals within overbought and oversold zones.
- Parabolic SAR: Provides a simple visual cue for trend direction and can be used as a trailing stop reference with minimal interpretation required.
Best Advanced Forex Indicators
These indicators require more experience to interpret correctly, but offer significant additional depth for traders who have mastered the basics.
- Ichimoku Cloud: The Ichimoku Kinko Hyo (meaning “equilibrium at a glance”) provides a complete picture of support, resistance, trend direction, and momentum in a single indicator. It consists of five components: Tenkan-sen (conversion line), Kijun-sen (base line), Senkou Span A and B (forming the cloud), and Chikou Span (lagging line). When the price is above the cloud, the trend is bullish. When below, it is bearish. The cloud itself acts as dynamic support and resistance. The Ichimoku is powerful but requires time to learn to read correctly.
- ATR: While technically straightforward to understand, ATR’s real value comes in how it informs position sizing and stop-loss calibration across different pairs and conditions. Applying it consistently requires experience.
- Fibonacci Retracement: Identifying the correct swing points to draw from, and combining retracement levels with candlestick analysis or RSI divergence, requires chart reading skills that develop with practice.
- VWAP and Volume Profile: Particularly useful for understanding institutional order flow and identifying high-value price zones, but requires familiarity with volume-based analysis frameworks.
Best Indicator Combinations for Forex Trading
Using indicators from different categories reduces redundancy and provides more reliable confirmation signals. Here are the most effective combinations used in practice:
- EMA + RSI (trend and momentum): The 20 EMA determines trend direction. RSI confirms momentum. Enter long trades when the price is above the 20 EMA, and RSI pulls back to 40-50 and turns up. Enter short trades when the price is below the 20 EMA, and RSI bounces to 50-60 and turns down. This is one of the most reliable beginner combinations and forms the basis of many professional manual strategies.
- MACD + Bollinger Bands (trend confirmation and volatility): A Bollinger Band squeeze followed by a breakout is the setup trigger. MACD crossover or histogram expansion in the direction of the breakout provides confirmation. This combination is effective on the 1-hour and 4-hour charts for day and swing traders.
- Fibonacci Retracement + RSI + EMA (multi-confirmation entry): Identify a clear trend using the 50 EMA. Draw Fibonacci from the last swing to the recent extreme. Wait for the price to pull back to the 38.2% or 61.8% level. Confirm with RSI divergence or an RSI reading returning from an extreme. This three-factor confirmation approach significantly reduces false entries compared to using any one tool alone.
- Stochastic + ATR (timing and risk calibration): Stochastic identifies the short-term momentum turning point. ATR determines the stop-loss distance. This combination separates entry logic from risk management logic and works well on the 15-minute to 1-hour charts for scalpers and day traders.
- Support/Resistance + ATR (price action and volatility): Identify key daily or weekly support and resistance levels. Use ATR to confirm whether the current volatility environment supports a trade at those levels, and to set a proportional stop-loss. This is a clean, indicator-light approach favored by more experienced manual traders.
Which Indicators Work Best on Each Timeframe?
Different indicators suit different trading styles and timeframes. Matching the right tools to your timeframe improves signal quality and reduces noise.
| Trading Style | Timeframe | Recommended Indicators |
| Scalping | M1, M5, M15 | EMA (9, 20), RSI, Stochastic, ATR |
| Day trading | M15, M30, H1 | MACD, EMA (20, 50), Bollinger Bands, VWAP, ATR |
| Swing trading | H4, Daily | Fibonacci, Bollinger Bands, RSI, EMA (50, 200), ATR |
| Position trading | Daily, Weekly | Ichimoku Cloud, 200 SMA, MACD, Pivot Points |
On shorter timeframes, indicators react faster and generate more signals, but also more false signals. On higher timeframes, signals are slower but more reliable. Most experienced traders use higher timeframes for directional bias and lower timeframes for entry timing.
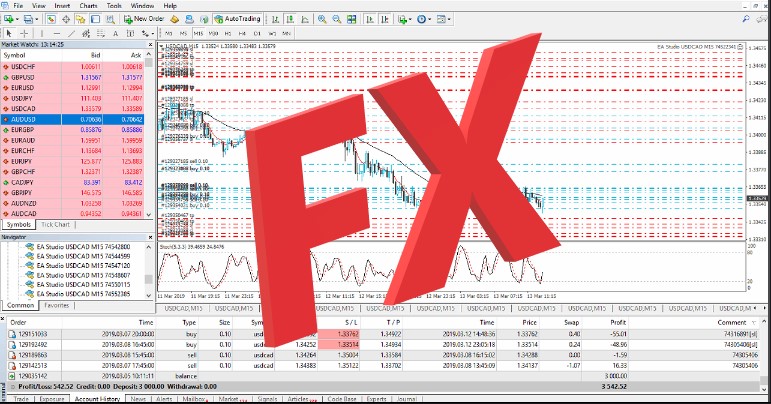
Best Indicators for MetaTrader 4 and MetaTrader 5
All indicators covered in this guide are built into MetaTrader 4 and MetaTrader 5 by default, with the exception of VWAP and Volume Profile, which require custom indicator files.
Built into MT4 and MT5 by default:
- Moving Averages (SMA, EMA, WMA, SMMA)
- MACD
- RSI
- Bollinger Bands
- Stochastic Oscillator
- ATR
- Parabolic SAR
- Accumulation/Distribution
- On-Balance Volume (OBV)
Available via custom indicators (free download from MQL5 marketplace):
- Ichimoku Cloud (also built into MT4/MT5 in most broker versions)
- VWAP
- Volume Profile
- Fibonacci Auto-Draw tools
- Pivot Point indicators
To add a built-in indicator in MT4 or MT5, click “Insert” in the top menu, then “Indicators,” and select the appropriate category (Trend, Oscillators, Volumes, Custom). The indicator will appear on your chart with adjustable settings.
For algorithmic trading, all these indicators can be referenced within Expert Advisor code using MQL4 or MQL5 functions, allowing automated strategies to make decisions based on indicator values without manual intervention.
Indicators vs Price Action: Which Should You Use?
This is one of the most common debates in forex trading. The honest answer is that both approaches have merit, and the best traders often use elements of both.
- The case for indicators: Indicators systematically process price data and remove the subjective interpretation required in pure price action analysis. They are consistent, programmable, and can be backtested objectively. For algorithmic traders, indicators are essential: an Expert Advisor cannot act on a “gut feel” about a candlestick pattern, but it can act precisely on an RSI reading or EMA crossover.
- The case for price action: Price action (reading candlestick patterns, support and resistance, market structure) gives traders direct insight into what the market is doing without the lag that all indicators introduce, since all indicators are derived from the price that has already moved. Experienced price action traders argue that reading the chart directly is more responsive than waiting for an indicator to confirm what price has already shown.
- The practical conclusion: Most successful traders use a hybrid approach. They use one or two indicators to provide an objective framework (trend direction, momentum state), and use price action reading (candlestick confirmation, key level reactions) to refine entry timing. This reduces both the lag of pure indicator reliance and the subjectivity of pure price action analysis.
At Algo Trading Space, the algorithmic strategies we build and test on live accounts are indicator-based by necessity, since EAs require mathematical rules. Our experience building and live-testing hundreds of these systems across EUR/USD, GBP/USD, gold, and other instruments has shown that the most consistent strategies use simple indicator logic applied with rigorous backtesting and forward-testing discipline, rather than complex multi-indicator systems.
Frequently Asked Questions
What is the most accurate forex indicator?
No single forex indicator is reliably “the most accurate.” All indicators are derived from historical price data and involve a trade-off between sensitivity and reliability. The RSI and MACD are consistently cited as among the most useful due to their clear signals and versatility across multiple timeframes. In practice, the accuracy of any indicator depends heavily on market conditions, timeframe, and how it is combined with other analytical tools.
Which indicator is best for beginners?
The 20 EMA combined with RSI is widely considered the most beginner-friendly combination. The EMA provides a clear trend filter (price above = look for buys, price below = look for sells), and the RSI adds momentum context without complexity. Moving averages are also the most widely taught starting point across institutional trading education programs globally.
Do professional traders use indicators?
Yes, though with more discipline and selectivity than most beginners. Professional traders typically use one to three indicators, understand precisely what each one measures, and use them to confirm a thesis rather than to generate trade ideas in isolation. Many systematic and algorithmic traders also build entire strategies around indicator logic, particularly moving average crossovers, RSI divergence, and ATR-based volatility filters.
What indicators work best together?
The most effective combinations pair indicators from different categories to avoid redundancy. Trend + Momentum (EMA + RSI) is the most commonly used pairing. Adding a volatility indicator (ATR or Bollinger Bands) completes a setup by providing stop-loss context. Avoid combining multiple indicators that measure the same thing, such as RSI and Stochastic simultaneously, as they will provide similar signals and create an illusion of confirmation without adding real information.
Are indicators better than price action?
Neither is inherently better. Indicators are more systematic, consistent, and programmable, making them essential for algorithmic trading. Price action is more direct, less lagged, and requires no secondary calculation. Most experienced traders use a combination: indicators for directional and momentum context, price action for entry timing, and confirmation.
How many forex indicators should I use?
Most professional traders use between one and three indicators on any given chart. Using more than three indicators typically results in analysis paralysis, contradictory signals, and reduced decision quality. The goal is not to collect confirmation from many sources but to have a clear, testable setup logic with the minimum number of inputs needed to make a sound decision.