

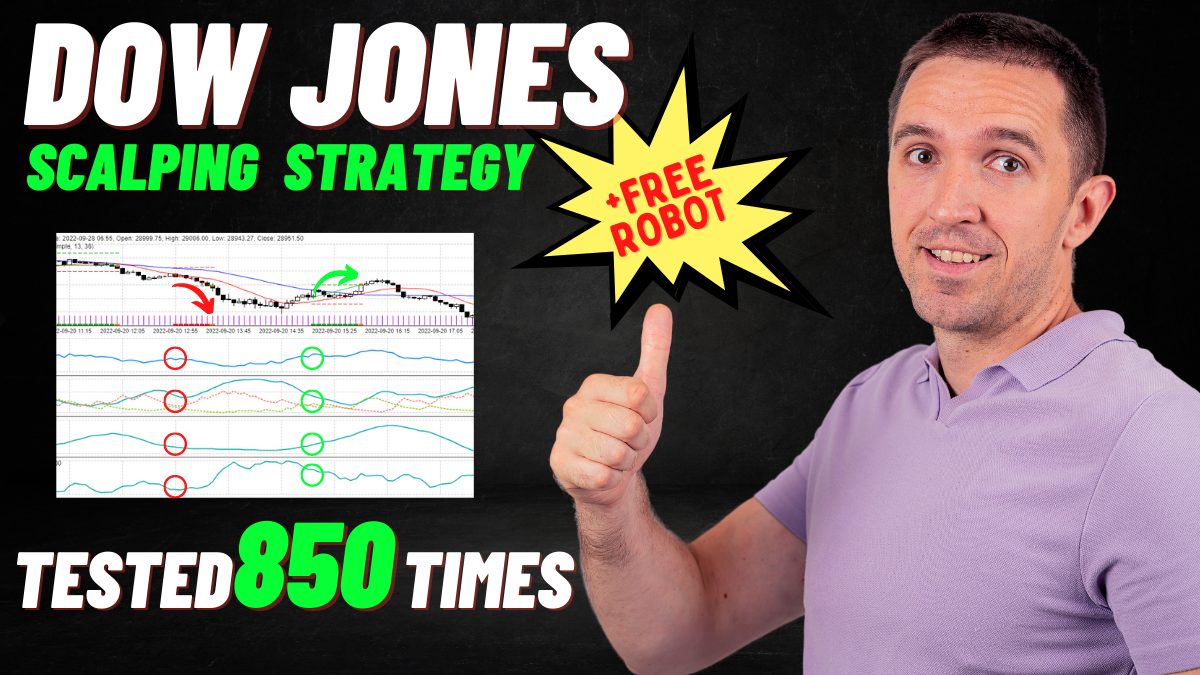
A Dow Jones scalping strategy opens and closes index positions inside minutes, using tightly specified technical triggers rather than a view on where the market is heading. The setup described here combines a momentum oscillator, a level-crossing filter, a stochastic confirmation and a volatility ceiling, then exits on a fixed protective stop or a fixed target. Everything below comes from one EA Studio test, and the figures describe that test rather than any future outcome.
Updated September 2026. Rules and indicator settings were reviewed against the original build and its accompanying video. Two details were never recorded and cannot be reconstructed honestly after the fact: the chart period the test ran on, and the instrument it ran against. Both are called out below rather than glossed over.
Dow Jones scalping strategy at a glance
| Parameter | Setting |
| Market | A Dow Jones index product. The symbol used in testing was not recorded, so read every distance below against your own instrument |
| Chart period | Not recorded. The original build predates the documentation standard applied to this update |
| Long entry | RSI(15) falls through level 30, IDX(14) crosses its level line downward at 41, Stochastic (K 20, D 1, Slowing 15) rises from below level 20, and ATR(5) sits under level 104 |
| Short entry | Every long condition reversed |
| Stop loss | 5,000 points, in the platform’s own point convention |
| Take profit | 8,850 points, same convention |
| Additional exit | None. Positions close at the stop or the target |
| Profit factor | 1.12 in the reported test |
| Maximum drawdown | 10% in the reported test |
| Win/loss ratio | 0.49 in the reported test |
Two rows say “not recorded” rather than carrying a number, and that is deliberate. Publishing a plausible-looking value for either would make this page easier to read and less true. What follows explains how to work around both gaps.
What a Dow Jones scalping setup does differently
Scalping compresses the holding period until fundamentals stop mattering. A position that lives four minutes is not expressing a view on interest rates or earnings season; it harvests a small, repeatable move and pays a spread for the privilege. Three consequences follow, and each drives a decision later on:
- Costs dominate. A target worth a handful of index points can be erased by a widening bid/ask difference, so execution costs deserve more attention than signal quality.
- Sample sizes get large quickly. Hundreds of short trades produce statistics that look convincing while remaining fragile, since one market condition may be represented over and over.
- Automation becomes close to mandatory. Tracking four readings that must agree on a one-minute or five-minute chart is not something a person does reliably across a session.
The benchmark itself adds a wrinkle. Because the Dow Jones Industrial Average is price-weighted across thirty large American companies, a move in one high-priced constituent shifts it more than the same move in a cheaper one. Index behaviour does not mirror a major currency pair.
Which Dow are you actually trading?
“Dow Jones” describes an index, not a tradeable product. Three distinct instruments track the same benchmark with different quoting conventions, costs and session hours.
| Product | What it is | Sizing | Typical retail access |
| DJIA cash index | The benchmark itself | Not directly tradeable | Reference only |
| Index CFD (often labelled US30 or Wall Street 30) | An over-the-counter contract tracking the index | Broker-defined contract size, quoting decimals vary by firm | Retail brokers, most MetaTrader accounts |
| E-mini Dow futures (YM) | Exchange-listed contract on CBOT | $5 per index point, minimum move one full index point (CME Group) | Futures broker, exchange margin |
Regulatory treatment differs too. Under the European product intervention regime, retail CFD positions on major equity indices are capped at 20:1 leverage (ESMA, 2018), alongside negative balance protection and a margin close-out rule. A futures account sits under a different framework entirely.
Session hours diverge as well. The exchange-listed contract trades almost around the clock, while individual CFD providers set their own index hours and may pause quoting across the daily maintenance window.
Since the tested symbol was never written down, treat the whole parameter set as calibrated to an unidentified quoting convention. That dictates the sequence: identify your instrument, open its contract specification, establish what a single point is worth in account currency, and only then read anything into the figures above. Two firms labelling their product “US30” can quote it differently.
The entry rules, stated once
Four conditions must be satisfied on the same bar. Three of them act as filters; one is the triggering event.
Long entries. The bar must show RSI on a period of 15 falling through the 30 level. At that same moment, IDX on a period of 14 must be crossing its level line of 41 in a downward direction, the Stochastic oscillator configured with a K period of 20, a D period of 1 and slowing of 15 must be turning upward from beneath level 20, and ATR on a period of 5 must be reading below the 104 level. The order is filled at the open of the following bar.
Short entries. Reverse each condition. Nothing else changes, including the protective distances.
One structural point is worth making explicit. All four readings are assessed on the same completed bar and the order fills at the next open, which makes this a bar-close system rather than a tick-level one. Your entry price can therefore sit some way from the price that produced the signal, and the gap widens as volatility rises. Containing that is part of what the volatility ceiling is for.
Which of the four is the event and which are confirmations? Petko Aleksandrov posed exactly that question to viewers as a competition and did not answer it on camera. Resolve it by testing: run the logic with each condition in turn as the trigger, then compare the resulting trade lists.
Choosing a chart period, since none was published
The original build did not record its timeframe, so pick one deliberately rather than inheriting a default. Two tests narrow the choice fast.
Start with volatility. A ceiling of 104 on ATR(5) only works as a brake if it actually blocks trades, and Average True Range scales with the bars it measures. Load the indicator on each candidate chart and see where 104 sits against typical readings; any period where that line never binds has lost the brake entirely.
Then check the protective distances against normal price travel. Where price rarely covers 8,850 points inside a plausible holding time, positions stay open until something else closes them. Where both levels fall inside a single candle, the entry logic stops meaning anything. Run a short test on each surviving candidate, record the trade count, and discard whatever produces too few results to reason about.
Stop loss, take profit and what “points” means here
The original article used three different words for one distance: points, pips, and dollars. Those are not interchangeable, and conflating them is how traders end up sizing a position ten times larger than intended.
| Parameter | Value as configured | What you must verify locally |
| Stop loss | 5,000 points | How many decimal places your broker quotes the index to, and therefore what 5,000 points equals in index points |
| Take profit | 8,850 points | Same conversion, then the cash value of that distance at your contract size |
| Reward-to-risk | 1.77 to 1 as configured | Unchanged by the conversion, since both distances scale together |
The one anchor available comes from the video, where reaching the target is described as worth roughly $86 to $88 on a full lot, with the variation attributed to the spread. That is consistent with 8,850 platform points mapping to about 88 index points on a two-decimal quote. Treat it as an illustration of the arithmetic rather than a figure to plan around, since contract size and quoting precision belong to your broker.
One worked example makes the risk concrete. At 1.77 to 1 with a win/loss ratio near 0.49, roughly one trade in three must reach target simply to break even before costs.
The indicators, and why each is in the stack
RSI, period 15, level 30. Relative Strength Index measures the ratio of recent gains to recent losses on a 0 to 100 scale, and a fall through 30 marks short-term exhaustion in selling pressure. The period of 15 runs one longer than the conventional 14, making the reading marginally slower and less prone to firing on single-bar noise.
IDX, period 14, level 41. This is the label the strategy builder carried, and it is not a standard MetaTrader indicator name. The original publication never defined it, and no definition can be supplied here without guessing. Open the strategy file in whichever builder you use and read the name from the entry condition itself; that name, not this label, is authoritative. Until it is settled, treat this as the one component you cannot yet reproduce independently, and weight your confidence accordingly.
Stochastic, K 20, D 1, slowing 15, level 20. This oscillator compares the closing price to its recent range. Rising from beneath 20 while the other filters agree is the confirmation leg: entry happens as weakness begins to reverse, not while it deepens.
ATR, period 5, level 104. Average True Range quantifies recent volatility in price units, and requiring it to sit below a ceiling turns it into a brake: when the index moves violently, nothing opens. For a scalping design this is arguably the most important of the four, since fast conditions are where slippage and spread widening do the most damage. The threshold is scale-dependent, so 104 means something only in the quoting convention it was calibrated on. Change the decimals or the lot definition and that ceiling, along with the stop and the target, needs deriving from scratch.
Backtest results, and what they do not establish
Three statistics survive from the original test.
| Metric | Reported value |
| Profit factor | 1.12 |
| Maximum drawdown | 10% |
| Win/loss ratio | 0.49 |
A profit factor above 1 means gross profits exceeded gross losses across the measured sample. It does not mean the system is profitable in any forward sense, and at 1.12 the margin is thin. Consider the arithmetic: gross losses of $10,000 imply gross profits of $11,200, leaving $1,200 of net gain. Add a modest commission and a spread assumption slightly wider than the test used, applied across every one of those trades, and that surplus can disappear entirely. Thin edges are not disqualifying, but they demand tighter cost assumptions than generous ones do.
The surrounding methodology was not documented, and reconstructing it now would mean inventing it. Here is the honest position:
| What is known | What was never recorded |
| Profit factor of 1.12, maximum drawdown of 10%, win/loss ratio of 0.49 | Test period, trade count, data source and quality |
| The test ran in EA Studio on a Dow Jones index product | Symbol, chart period, spread and commission assumptions |
| Entry logic, indicator settings and both protective distances | Starting balance, position sizing, slippage model, out-of-sample validation |
That right-hand column matters more than it might appear. Without a trade count, a 10% drawdown says nothing about how deep the next one goes, and 1.12 might equally describe a decade or a fortnight. These figures appear because they are what that run produced, not because they should carry weight in a decision to trade.
The practical response is to generate your own. The rules above are complete enough to rebuild, and a fresh test on your instrument with your costs produces numbers you can actually interrogate. Those supersede everything in this section.
When this Dow Jones scalping setup struggles
Short-horizon index systems fail in characteristic ways. None of these are hypothetical concerns; they are the standard reasons a promising equity curve does not survive contact with real execution.
- Spread widening at the cash open. Index quotes typically loosen around the New York session start and around scheduled data. A target of a few dozen index points is disproportionately sensitive to that.
- Slippage on stop fills. Protective stops are executed at the next available price, which during fast moves may be materially worse than the level requested.
- Broker quote differences. Contract size, decimals and financing charges vary between firms, so identical logic produces different results on different accounts.
- Execution latency. Bar-close evaluation followed by a next-open fill leaves a window in which price has already moved.
- Parameter overfitting. A period of 15 rather than 14, a level of 41 rather than 40, a ceiling of 104 rather than 100: those precise values are the signature of an optimiser fitted to history. Walk-forward testing is the usual check.
- Sample adequacy. A profit factor calculated across thirty or forty fills tells you almost nothing.
Financing costs deserve a mention too. Index CFDs held across a daily rollover attract a swap charge, and an automated version that stalls in a position through that moment will quietly pay it. Check how your provider handles it before running the robot unattended overnight.
The broader base rate deserves stating plainly. Analysis by national regulators across the European Union found that between 74% and 89% of retail accounts typically lose money trading CFDs, with average losses per client ranging from €1,600 to €29,000 (ESMA, March 2018). A system with a thin measured edge does not move a trader out of that distribution by itself.
How to test this before risking money
Rebuild rather than trust. The sequence below answers the questions this article cannot.
- Confirm your symbol, its contract size and its quoting decimals from the broker’s specification page.
- Convert both protective distances into index points and into account currency at your intended position size.
- Load the four conditions with the periods and levels from the table above, resolving the IDX label against your own builder’s indicator list.
- Sweep the candidate chart periods described earlier and pick one on evidence rather than habit.
- Run the test on your own broker’s data with a realistic spread and commission, not the platform defaults. Our guide to backtesting in MetaTrader 5 covers the settings that matter.
- Reserve a period the optimiser never saw, check whether performance holds there, then forward-test on demo long enough to build a meaningful trade count before real money is involved.
Step five is where most published systems come apart, and it is worth understanding why backtest results diverge from live trading before you interpret your own output.
Automating the rules
Watching four filters agree in real time is not realistic by hand, which is why this began life as an expert advisor. A builder generates the code, tests variations and exports something that runs unattended. Petko Aleksandrov, who developed the system, has made the compiled robot available free alongside his walkthrough.
Be clear about what the software does and does not establish. A builder is an implementation and testing environment: it strips out mistimed clicks and accelerates the testing loop. It does not validate the underlying edge, and anything exported from one carries exactly the evidence its test period supports. That principle applies equally across algorithmic approaches to the Dow and one-minute scalping systems.
Frequently asked questions
What timeframe does this Dow Jones scalping strategy use?
The chart period was never recorded when the system was built, so no published answer exists. Rather than adopt a default, compare several candidates on three measures: how often the ATR ceiling of 104 actually blocks a trade, whether price reaches the target inside a sensible holding window, and how many trades each generates. Any candidate producing almost no signals, or where the 104 ceiling never binds, can be discarded immediately.
Which indicators does this setup use?
Four: Relative Strength Index on a period of 15 with a level of 30, an indicator the builder labelled IDX on a period of 14 with a level of 41, the Stochastic oscillator configured with K 20, D 1 and slowing 15 against a level of 20, and Average True Range on a period of 5 with a ceiling of 104. IDX is not a standard MetaTrader name and was never defined, so check what it resolves to inside your own strategy file.
Can this Dow Jones setup take short positions?
Yes. Short entries mirror the long conditions exactly, with each indicator requirement reversed, and both directions share identical protective distances: 5,000 points for the stop and 8,850 points for the target. Nothing in the published rules treats the two directions asymmetrically. Whether symmetry is appropriate for an equity index, which historically falls faster than it rises, is a question the original testing does not appear to have examined.
What did the backtest actually report?
Three figures: a profit factor of 1.12, a maximum drawdown of 10%, and a win/loss ratio of 0.49. Those describe one run in EA Studio. Test period, trade count, symbol, spread assumption and commission model were not documented at the time, so the statistics cannot be independently assessed and are reproduced here for completeness rather than as evidence. A margin that close to 1.00 leaves little room for real-world costs.
Does the strategy work on US30 CFDs?
The logic can be applied to any Dow-tracking instrument, but the numeric thresholds cannot be transferred without recalculation. ATR is expressed in price units, so a ceiling of 104 is calibrated to one specific quoting convention, and that convention was not recorded. Any instrument quoted to a different precision, or sized differently, needs all three numeric levels derived again from its own data. Applying the published figures to an unverified symbol is the most likely way to get an unpleasant surprise.
How many trades were in the test?
Not published, and that omission carries weight. Drawdown and profit factor both become progressively more meaningful as the sample grows, and thirty or forty results support almost no inference about future behaviour. When you reconstruct these rules yourself, record your own trade count carefully and treat any result drawn from a small sample as strictly provisional. Sample adequacy is a threshold question rather than a refinement, so decide your minimum before you look at the equity curve.
Can this be run as an expert advisor?
It was designed that way. Four readings assessed together when a bar completes, with entry at the following open, is a specification written for software rather than for hand execution. A ready-made robot accompanies the original video at no cost, and the logic can equally be reconstructed in any builder that supports these four indicators. Automation removes the human execution error; it does not improve the underlying statistical edge, and a flawed system will be run faithfully.
Before you test this
If you are rebuilding this setup and want a second opinion on your chart period, your IDX resolution or your testing methodology before money goes on the line, get in touch with Algo Trading Space. Working out what a strategy does not tell you is usually worth more than another set of entry rules.
Trading indices and leveraged products carries a risk of loss, and losses can exceed deposits on some account types. Nothing on this page is financial advice, and all figures describe historical testing rather than expected future results.


Comments
No comments yet. Be the first to comment!
Leave a Comment
Your email address will not be published. Required fields are marked with *